## Histogram: First Correct Answer Emergence
### Overview
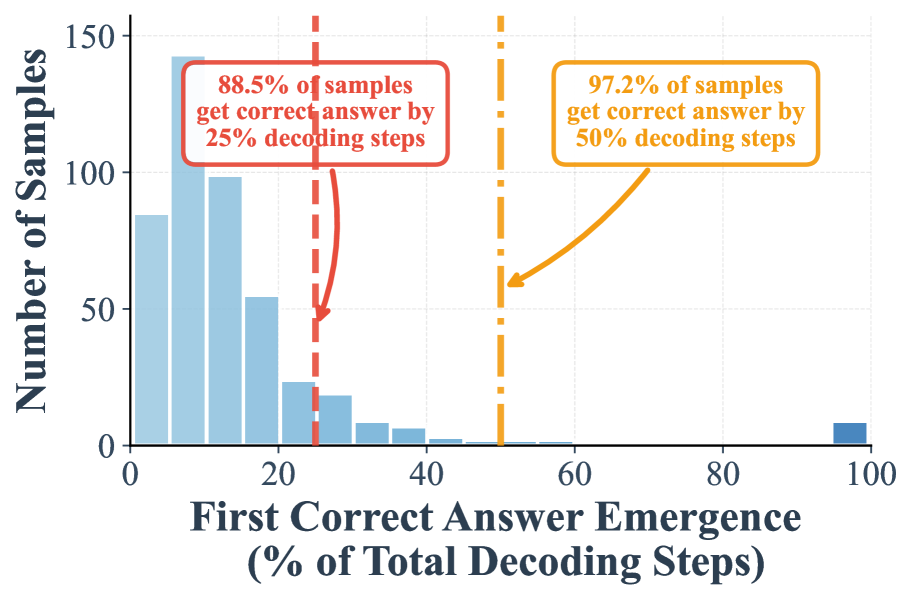
The image is a histogram showing the distribution of the "First Correct Answer Emergence" as a percentage of total decoding steps. The x-axis represents the percentage of total decoding steps, and the y-axis represents the number of samples. Two vertical lines are overlaid on the histogram, indicating the percentage of samples that achieve a correct answer by 25% and 50% of the decoding steps, respectively.
### Components/Axes
* **X-axis:** "First Correct Answer Emergence (% of Total Decoding Steps)". The axis ranges from 0 to 100, with tick marks at intervals of 20 (0, 20, 40, 60, 80, 100).
* **Y-axis:** "Number of Samples". The axis ranges from 0 to 150, with tick marks at intervals of 50 (0, 50, 100, 150).
* **Bars:** Light blue bars represent the frequency of samples for each percentage range of decoding steps.
* **Vertical Lines:**
* A dashed red vertical line is positioned at approximately 25% of total decoding steps. A red box indicates that 88.5% of samples get the correct answer by 25% decoding steps.
* A dashed-dotted orange vertical line is positioned at approximately 50% of total decoding steps. An orange box indicates that 97.2% of samples get the correct answer by 50% decoding steps.
### Detailed Analysis
The histogram shows a right-skewed distribution. The majority of samples achieve a correct answer within the first 25% of decoding steps. The frequency of samples decreases as the percentage of decoding steps increases.
* **0-20%:** The number of samples in this range is high, with the first bar (0%) reaching approximately 85 samples, and the bar at 20% reaching approximately 55 samples.
* **20-40%:** The number of samples decreases significantly in this range. The bar at 30% reaches approximately 10 samples.
* **40-100%:** The number of samples is very low in this range, with only a single bar at 100% reaching approximately 10 samples.
### Key Observations
* A large proportion of samples (88.5%) achieve a correct answer within the first 25% of decoding steps.
* An even larger proportion of samples (97.2%) achieve a correct answer within the first 50% of decoding steps.
* The distribution is heavily skewed towards the left, indicating that most samples converge to a correct answer relatively quickly.
### Interpretation
The data suggests that the decoding process is efficient, with the majority of samples converging to a correct answer within the first half of the decoding steps. The high percentages of samples achieving correct answers by 25% and 50% of decoding steps indicate that the model or algorithm being evaluated is performing well. The right-skewed distribution suggests that while most samples converge quickly, there are some outliers that require a significantly larger number of decoding steps to reach a correct answer. This could be due to the complexity of the input data or the presence of noise.