\n
## Histogram: First Correct Answer Emergence
### Overview
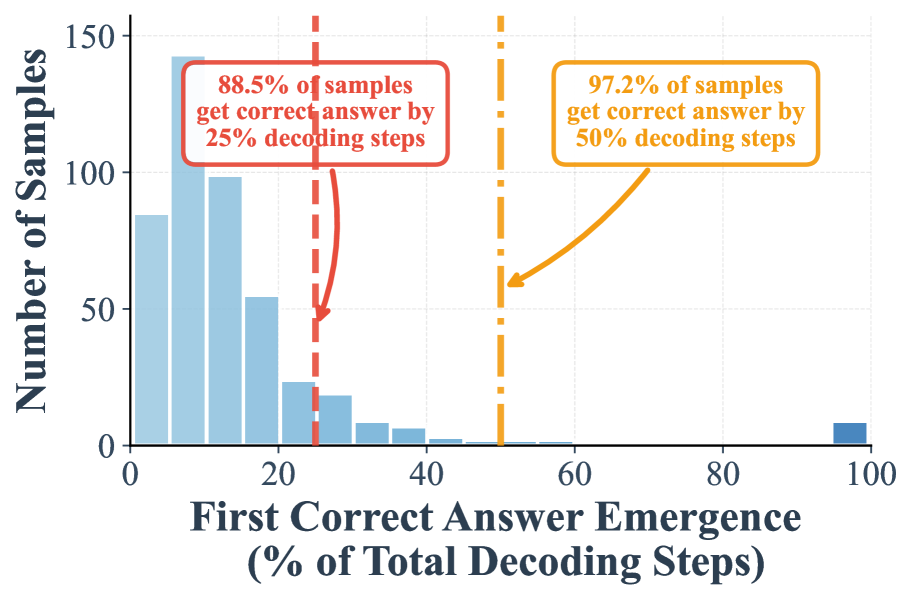
The image presents a histogram illustrating the distribution of the percentage of total decoding steps required for the first correct answer to emerge. It also includes annotations indicating the percentage of samples achieving a correct answer within 25% and 50% of decoding steps. An orange line shows the cumulative percentage of samples.
### Components/Axes
* **X-axis Title:** "First Correct Answer Emergence (% of Total Decoding Steps)" - Scale ranges from 0 to 100, with increments of 10.
* **Y-axis Title:** "Number of Samples" - Scale ranges from 0 to 150, with increments of 50.
* **Histogram Bars:** Represent the frequency distribution of the percentage of decoding steps.
* **Orange Line:** Represents the cumulative percentage of samples achieving a correct answer by a given decoding step percentage.
* **Red Dashed Line:** Located at approximately 20% on the x-axis, with the annotation "88.5% of samples get correct answer by 25% decoding steps".
* **Orange Dashed Line:** Located at approximately 50% on the x-axis, with the annotation "97.2% of samples get correct answer by 50% decoding steps".
### Detailed Analysis
The histogram shows a strong right skew. The majority of samples achieve a correct answer with a relatively small number of decoding steps.
* **Bar Heights (Approximate):**
* 0-10%: ~110 samples
* 10-20%: ~55 samples
* 20-30%: ~25 samples
* 30-40%: ~12 samples
* 40-50%: ~7 samples
* 50-60%: ~4 samples
* 60-70%: ~2 samples
* 70-80%: ~1 sample
* 80-90%: ~0 samples
* 90-100%: ~1 sample
* **Orange Line Trend:** The orange line starts near zero, rises steeply, and then plateaus. This indicates that a large proportion of samples achieve a correct answer quickly, and the rate of improvement slows down as more decoding steps are required.
* At 25% decoding steps, the orange line reaches approximately 88.5% (as annotated).
* At 50% decoding steps, the orange line reaches approximately 97.2% (as annotated).
* The line continues to rise slowly, approaching 100% as the decoding steps increase.
### Key Observations
* The data is heavily skewed towards lower decoding step percentages.
* A significant majority (88.5%) of samples achieve a correct answer within the first 25% of decoding steps.
* Almost all samples (97.2%) achieve a correct answer within the first 50% of decoding steps.
* Very few samples require more than 50% of the total decoding steps to achieve a correct answer.
### Interpretation
The data suggests that the decoding process is highly efficient, with most samples converging on the correct answer relatively quickly. The rapid increase in the cumulative percentage curve indicates a fast initial learning or convergence phase. The annotations highlight that a large proportion of the samples achieve a correct answer within a small fraction of the total decoding steps, suggesting that the system is effective at identifying the correct answer early in the process. The right skew indicates that while most samples converge quickly, a small number require significantly more decoding steps, potentially due to more complex or ambiguous inputs. This could be indicative of the system's limitations or the inherent difficulty of certain cases. The data implies a strong correlation between decoding steps and answer correctness, with a diminishing return as decoding steps increase.