## Scatter Plot: Accuracy Variance Across Clients (CIFAR-10 Dataset)
### Overview
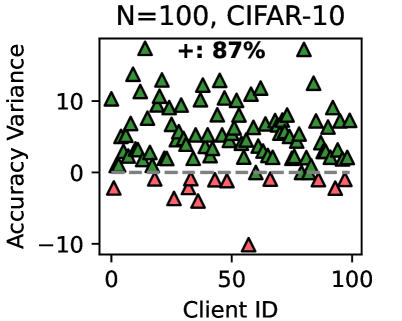
The image is a scatter plot visualizing the distribution of accuracy variance across 100 clients in the CIFAR-10 dataset. Data points are represented by colored triangles, with a dashed horizontal line at 0 accuracy variance for reference. The plot highlights a significant imbalance between clients with positive and negative accuracy variance.
### Components/Axes
- **X-axis**: Client ID (0 to 100, evenly spaced).
- **Y-axis**: Accuracy Variance (-10 to 10, linear scale).
- **Legend**: Located in the top-right corner.
- Green triangles: "+: 87%" (positive accuracy variance).
- Red triangles: "-: 13%" (negative accuracy variance).
- **Dashed Line**: Horizontal line at y=0, separating positive and negative variance.
### Detailed Analysis
- **Green Triangles (87%)**:
- Majority clustered between y=0 and y=10, with a few outliers below y=0.
- Spatial distribution: Concentrated in the upper half of the plot, indicating most clients have positive variance.
- **Red Triangles (13%)**:
- Primarily clustered between y=-10 and y=0, with one outlier above y=0.
- Spatial distribution: Dominates the lower half of the plot, indicating most clients have negative variance.
- **Dashed Line**: Acts as a baseline; 87% of data points (green) lie above it, while 13% (red) lie below.
### Key Observations
1. **Dominance of Positive Variance**: 87% of clients exhibit higher accuracy than the baseline (y=0), suggesting robust performance for most clients.
2. **Notable Outliers**:
- A single red triangle (Client ID ~50) lies above y=0, indicating an exception in the negative variance group.
- Several green triangles (Client IDs ~10, 30, 70) fall below y=0, showing exceptions in the positive variance group.
3. **Variability**: The spread of points (y=-10 to y=10) reflects significant client-to-client performance differences.
### Interpretation
The data suggests that in the CIFAR-10 dataset with 100 clients:
- **Model Robustness**: Most clients (87%) achieve higher accuracy than the baseline, possibly due to effective training or data distribution alignment.
- **Performance Variability**: The 13% of clients with negative variance may indicate issues like overfitting, data scarcity, or misalignment with the global model.
- **Outlier Implications**: The red triangle above y=0 and green triangles below y=0 highlight edge cases that warrant further investigation (e.g., data quality, client-specific biases).
This visualization underscores the importance of client-level analysis in federated learning or distributed training scenarios, where performance disparities can impact overall system reliability.