## Scatter Plot: Accuracy Variance Across Clients (CIFAR-10)
### Overview
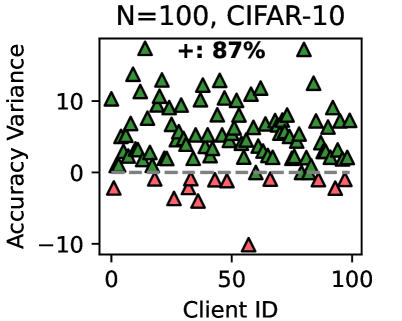
This is a scatter plot visualizing the "Accuracy Variance" for 100 distinct clients (N=100) on the CIFAR-10 dataset. The plot compares individual client performance against a baseline, indicated by a dashed horizontal line at zero variance. Data points are represented as triangles, colored either green or red based on their position relative to the baseline.
### Components/Axes
* **Title:** "N=100, CIFAR-10" (Top center)
* **X-Axis:** Labeled "Client ID". Scale runs from 0 to 100, with major tick marks at 0, 50, and 100.
* **Y-Axis:** Labeled "Accuracy Variance". Scale runs from -10 to 10, with major tick marks at -10, 0, and 10.
* **Legend:** Positioned in the top-right quadrant of the plot area. Contains a plus symbol (`+`) followed by the text "87%".
* **Baseline:** A dashed horizontal line at y = 0.
* **Data Points:** 100 triangle markers. The color coding is as follows:
* **Green Triangles:** Positioned above the y=0 baseline (positive accuracy variance).
* **Red Triangles:** Positioned below the y=0 baseline (negative accuracy variance).
### Detailed Analysis
* **Data Distribution:** The 100 data points (Client IDs 0-99) are scattered across the plot. The majority of points are green triangles located above the dashed zero line.
* **Green Points (Positive Variance):** These points are densely clustered between y=0 and y=15 (approximate upper bound of the visible cluster). Their distribution along the x-axis (Client ID) appears relatively uniform, with no obvious concentration in a specific ID range.
* **Red Points (Negative Variance):** These points are fewer in number and are located below the y=0 line. Most red points cluster between y=0 and y=-5. There is one significant outlier: a single red triangle located at approximately Client ID 55, with a y-value of -10 (the lowest point on the chart).
* **Legend Interpretation:** The legend entry "+: 87%" is placed in the top-right. Given the context, this likely indicates that 87% of the clients (87 out of 100) have a positive accuracy variance (i.e., are represented by green triangles above the line).
### Key Observations
1. **Predominance of Positive Variance:** The visual impression is dominated by green triangles, consistent with the 87% figure in the legend. This suggests most clients performed better than the baseline.
2. **Notable Outlier:** One client (ID ~55) shows a severe negative variance of -10, which is a clear outlier compared to the rest of the negative-variance clients.
3. **Variance Range:** The positive variance for most clients is contained within a band of approximately 0 to +12. The negative variance, excluding the outlier, is generally within 0 to -5.
4. **No Clear ID-Based Trend:** There is no apparent upward or downward trend in accuracy variance as the Client ID increases from 0 to 100. The performance appears independent of the client's numerical identifier.
### Interpretation
This chart likely originates from a **federated learning** or **distributed machine learning** experiment. In such setups, a model is trained across multiple decentralized clients (e.g., mobile devices or different data silos) holding local data samples.
* **"Accuracy Variance"** probably measures the difference in a client's local model accuracy compared to a global model's accuracy or a central baseline. A positive value means the client's local data allowed for better performance than the baseline.
* The **87% metric** is a key performance indicator, showing that the vast majority of clients achieved a local accuracy superior to the reference point. This suggests the federated training process was broadly effective across the client population.
* The **outlier at Client ID 55** is critically important. It represents a client whose local model performed significantly worse. This could be due to:
* **Non-IID Data:** The data on this client is fundamentally different or of much lower quality than the average.
* **System Issues:** Problems like network dropout, hardware limitations, or software bugs during that client's training round.
* **Adversarial Behavior:** In some contexts, this could indicate a malicious client attempting to degrade model performance.
* The **lack of correlation with Client ID** implies that performance is not tied to the order in which clients were registered or sampled, but rather to the intrinsic properties of each client's data or system.
**In summary, the visualization demonstrates a successful federated learning outcome for the CIFAR-10 task across 100 clients, with high overall positive variance (87%), but highlights the presence of at least one severely underperforming client that requires investigation.**