## Chart: R1-Llama | GPQA-D Accuracy vs Ratio
### Overview
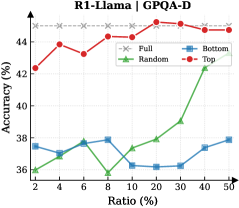
The image is a line chart comparing the accuracy (%) of different data selection methods (Full, Random, Bottom, Top) against the ratio (%) of data used. The chart shows how accuracy changes as the ratio of data increases for each method.
### Components/Axes
* **Title:** R1-Llama | GPQA-D
* **X-axis:** Ratio (%) - with markers at 2, 4, 6, 8, 10, 20, 30, 40, 50
* **Y-axis:** Accuracy (%) - with no explicit markers, but the range appears to be from approximately 35% to 45%.
* **Legend:** Located in the top-right corner.
* Full (gray dashed line with 'x' markers)
* Random (green line with triangle markers)
* Bottom (blue line with square markers)
* Top (red line with circle markers)
### Detailed Analysis
* **Full:** The gray dashed line representing "Full" data usage remains relatively constant at approximately 45% accuracy across all ratios.
* **Random:** The green line representing "Random" data usage starts at approximately 36% at a ratio of 2%, decreases to approximately 35.8% at a ratio of 8%, and then increases significantly to approximately 42.4% at a ratio of 40%.
* **Bottom:** The blue line representing "Bottom" data usage starts at approximately 37.5% at a ratio of 2%, decreases to approximately 37% at a ratio of 4%, increases to approximately 37.8% at a ratio of 6%, decreases to approximately 36.2% at a ratio of 10%, and then increases to approximately 37.4% at a ratio of 40%.
* **Top:** The red line representing "Top" data usage starts at approximately 42.4% at a ratio of 2%, increases to approximately 43.9% at a ratio of 4%, decreases to approximately 43.3% at a ratio of 6%, increases to approximately 44.4% at a ratio of 8%, and then remains relatively constant at approximately 44.7% at a ratio of 20%.
### Key Observations
* The "Full" data usage consistently provides the highest accuracy across all ratios.
* The "Top" data usage generally performs better than "Random" and "Bottom" data usage.
* The "Random" data usage shows a significant increase in accuracy as the ratio increases, particularly after a ratio of 10%.
* The "Bottom" data usage has the lowest accuracy among the three data selection methods.
### Interpretation
The chart suggests that using the full dataset ("Full") is the most effective approach for achieving high accuracy in the R1-Llama model for the GPQA-D task. Selecting data based on the "Top" method also yields relatively good results. The "Random" selection method shows improvement with increasing data ratio, while the "Bottom" selection method consistently underperforms. This indicates that the quality or relevance of the selected data significantly impacts the model's performance. The "Top" method likely selects the most informative or relevant data points, while the "Bottom" method selects the least informative ones. The "Random" method's performance improves as the ratio increases because it is more likely to include relevant data points as the sample size grows.