\n
## Diagram: Interconnected Rectangular Flow
### Overview
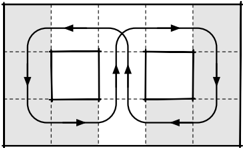
The image depicts a diagram illustrating a flow between two rectangular areas. The flow is represented by arrows indicating direction, and the rectangles are enclosed within a larger, shaded rectangular area. The diagram appears to represent a system with interconnected processes or components.
### Components/Axes
The diagram consists of the following components:
* **Two Rectangles:** Positioned side-by-side, forming the core of the flow.
* **Arrows:** Black arrows indicating the direction of flow. There are arrows circulating within each rectangle and arrows connecting the two rectangles.
* **Outer Rectangle:** A larger rectangle encompassing both inner rectangles, shaded in gray.
* **Grid:** A faint grid pattern in the background, likely for visual alignment.
There are no explicit axes or labels in the image.
### Detailed Analysis or Content Details
The diagram shows a cyclical flow within each rectangle.
* **Left Rectangle:** The flow within the left rectangle proceeds clockwise.
* **Right Rectangle:** The flow within the right rectangle also proceeds clockwise.
* **Interconnection:** Two arrows connect the left and right rectangles. One arrow points from the left rectangle to the right rectangle, and the other points from the right rectangle to the left rectangle. This indicates a bidirectional flow or exchange between the two rectangles.
* **Outer Shading:** The gray shading around the rectangles suggests a boundary or a common environment for the processes within.
### Key Observations
The diagram highlights a closed-loop system with interaction between two distinct components. The bidirectional arrows suggest a feedback mechanism or a continuous exchange of information or materials. The clockwise flow within each rectangle indicates a consistent process or cycle.
### Interpretation
This diagram likely represents a system with two interconnected processes or components operating in a cyclical manner. The bidirectional flow suggests a feedback loop, where the output of one process influences the other, and vice versa. The outer shading could represent a shared environment or a common constraint affecting both processes.
The diagram is abstract and does not provide specific details about the nature of the processes or the materials being exchanged. However, it effectively illustrates the concept of interconnectedness and cyclical flow within a system. It could be used to represent various systems, such as:
* **Control Systems:** Where feedback is used to regulate a process.
* **Biological Systems:** Where interconnected organs or processes maintain homeostasis.
* **Economic Systems:** Where supply and demand interact in a cyclical manner.
* **Chemical Processes:** Where reactants and products are continuously exchanged.
Without further context, the precise meaning of the diagram remains open to interpretation. However, the visual elements clearly convey the idea of a dynamic, interconnected system with cyclical processes.