## Diagram: Interconnected Cyclical System
### Overview
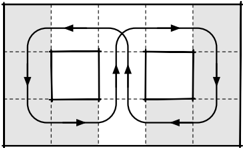
The image depicts a schematic diagram of two interconnected square components arranged horizontally. Arrows form a continuous loop around and between the squares, suggesting a cyclical or feedback-driven process. The background is divided into light gray and white vertical sections by dashed lines. No textual labels, legends, or numerical data are present.
### Components/Axes
- **Primary Elements**:
- Two identical square shapes positioned side-by-side.
- Arrows forming a closed loop:
- Outer arrows circulate clockwise around the perimeter of both squares.
- Inner arrows connect the squares bidirectionally (upward and downward).
- Dashed vertical lines segment the background into five equal-width columns.
- **Color Scheme**:
- Squares and arrows: Black.
- Background: Alternating light gray and white vertical stripes.
### Detailed Analysis
- **Spatial Grounding**:
- Squares are centered horizontally within the diagram.
- Arrows are evenly spaced along their paths, with no overlap or deviation.
- Dashed lines run vertically from top to bottom, dividing the diagram into five equal sections.
- **Flow Direction**:
- Outer loop: Clockwise circulation around the entire structure.
- Inner loop: Bidirectional arrows between the squares (top and bottom).
- **Absence of Text**:
- No labels, legends, or annotations are visible.
- No numerical values, units, or categorical identifiers are present.
### Key Observations
1. The diagram emphasizes symmetry and cyclicality, with no discernible start or end point.
2. The bidirectional inner arrows suggest mutual interaction or exchange between the two squares.
3. The dashed lines may imply segmentation or modularity in the system.
### Interpretation
This diagram likely represents a theoretical or abstract model of a system with reciprocal dependencies. The interconnected squares could symbolize two entities (e.g., processes, departments, or components) engaged in a continuous exchange, while the outer loop reinforces the cyclical nature of the process. The lack of labels or data points suggests the diagram is conceptual rather than data-driven, focusing on structural relationships rather than quantitative analysis. The bidirectional inner arrows highlight interdependence, whereas the outer loop underscores systemic continuity.