## Line Graph: Relationship Between A_CC_test and Parameters λ and r
### Overview
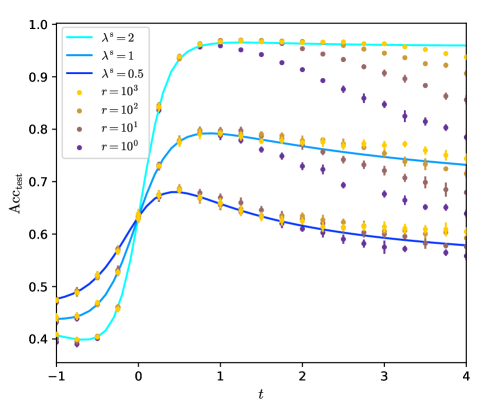
The graph illustrates the relationship between the variable **A_CC_test** (y-axis) and the parameter **t** (x-axis) under different conditions defined by **λ** (lambda) and **r** (radius). Four distinct data series are plotted, each represented by unique colors and markers. The legend is positioned in the top-right corner, and the axes are labeled with numerical ranges.
---
### Components/Axes
- **X-axis (t)**: Labeled as "t", ranging from **-1 to 4** in increments of 1.
- **Y-axis (A_CC_test)**: Labeled as "A_CC_test", ranging from **0.4 to 1.0** in increments of 0.1.
- **Legend**: Located in the **top-right corner**, with the following entries:
- **Cyan line**: λ = 2
- **Blue line**: λ = 0.5
- **Yellow circles**: r = 10³
- **Brown diamonds**: r = 10¹
---
### Detailed Analysis
#### Data Series Trends
1. **Cyan line (λ = 2)**:
- Starts at **t = -1** with **A_CC_test ≈ 0.4**.
- Rises sharply to **A_CC_test ≈ 0.95** by **t = 1**.
- Plateaus near **A_CC_test ≈ 1.0** for **t ≥ 1**.
- **Key values**:
- t = 0: 0.6
- t = 1: 0.95
- t = 4: 1.0
2. **Blue line (λ = 0.5)**:
- Starts at **t = -1** with **A_CC_test ≈ 0.45**.
- Increases gradually to **A_CC_test ≈ 0.75** by **t = 2**.
- Plateaus near **A_CC_test ≈ 0.7** for **t ≥ 2**.
- **Key values**:
- t = 0: 0.55
- t = 1: 0.75
- t = 4: 0.7
3. **Yellow circles (r = 10³)**:
- Starts at **t = -1** with **A_CC_test ≈ 0.45**.
- Peaks at **A_CC_test ≈ 0.85** around **t = 1**.
- Declines to **A_CC_test ≈ 0.65** by **t = 4**.
- **Key values**:
- t = 0: 0.6
- t = 1: 0.85
- t = 4: 0.65
4. **Brown diamonds (r = 10¹)**:
- Starts at **t = -1** with **A_CC_test ≈ 0.4**.
- Rises to **A_CC_test ≈ 0.75** around **t = 1**.
- Declines to **A_CC_test ≈ 0.6** by **t = 4**.
- **Key values**:
- t = 0: 0.5
- t = 1: 0.75
- t = 4: 0.6
---
### Key Observations
- **λ = 2** (cyan line) achieves the highest **A_CC_test** values, plateauing near **1.0** by **t = 1**.
- **λ = 0.5** (blue line) shows a slower increase, plateauing at **0.7** by **t = 2**.
- **r = 10³** (yellow circles) and **r = 10¹** (brown diamonds) exhibit **peaks at t = 1**, followed by a decline.
- The **peak magnitude** for **r = 10³** (0.85) is higher than for **r = 10¹** (0.75).
- All data series converge to **A_CC_test ≈ 0.6–0.7** by **t = 4**, except for **λ = 2**, which remains at **1.0**.
---
### Interpretation
The graph demonstrates how **A_CC_test** is influenced by the parameters **λ** and **r**:
1. **λ (lambda)**:
- Higher values (e.g., λ = 2) lead to **faster convergence** to higher **A_CC_test** values.
- Lower values (e.g., λ = 0.5) result in **slower growth** and lower plateaus.
2. **r (radius)**:
- Larger **r** (10³) produces a **higher peak** but **greater decline** over time.
- Smaller **r** (10¹) results in a **lower peak** and **slower decline**.
3. **t (time)**:
- The **initial rise** in **A_CC_test** is rapid for all series, but the **long-term behavior** depends on **λ** and **r**.
**Notable patterns**:
- The **cyan line (λ = 2)** dominates in terms of **maximum A_CC_test** and **stability**.
- The **yellow circles (r = 10³)** and **brown diamonds (r = 10¹)** show **non-monotonic behavior**, peaking at **t = 1** before declining.
- The **blue line (λ = 0.5)** and **brown diamonds (r = 10¹)** exhibit **similar trends**, suggesting a potential interaction between **λ** and **r**.
**Anomalies**:
- The **brown diamonds (r = 10¹)** show a **steeper decline** after **t = 1** compared to the **yellow circles (r = 10³)**, despite both peaking at **t = 1**.
- The **cyan line (λ = 2)** does not decline, indicating a **critical threshold** for **λ** that prevents decay.
This graph highlights the **trade-offs** between **λ** and **r** in optimizing **A_CC_test**, with **λ = 2** being the most effective parameter for achieving high and stable values.