\n
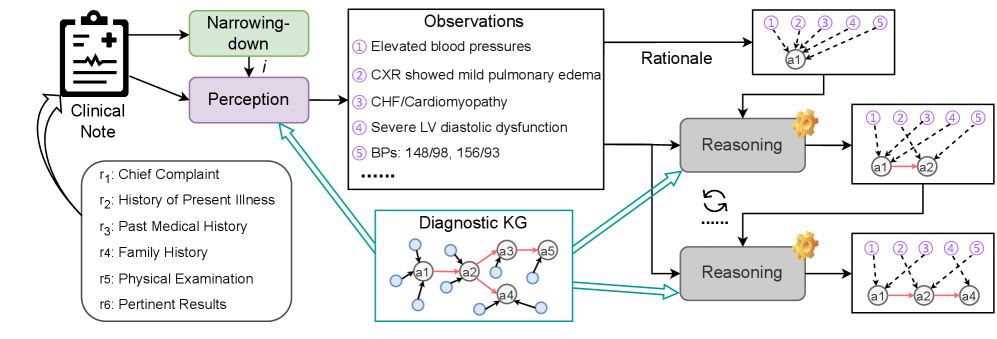
## Diagram: Clinical Note to Diagnostic Reasoning Flow
### Overview
This diagram illustrates a process for converting a clinical note into a diagnostic rationale, utilizing observations and a Diagnostic Knowledge Graph (KG). The process involves narrowing down information from the clinical note, perceiving relevant observations, and then applying reasoning based on both the observations and the KG. The diagram shows a cyclical process of reasoning and refinement.
### Components/Axes
The diagram consists of the following components:
* **Clinical Note:** Represented by a document icon with text and plus/minus symbols.
* **Narrowing-down:** A rectangular box labeled "Narrowing-down" with an arrow indicating information flow.
* **Perception:** A rectangular box labeled "Perception" with an arrow indicating information flow.
* **Observations:** A rectangular box labeled "Observations" containing a numbered list of medical observations.
* **Diagnostic KG:** A circular diagram representing a knowledge graph with nodes (a1-a5) and connections.
* **Rationale:** A rectangular box labeled "Rationale" containing a visual representation of connections between observations and rationale points.
* **Reasoning:** Two rectangular boxes labeled "Reasoning" with a cyclical arrow indicating iterative refinement.
The Clinical Note is broken down into components labeled:
* r1: Chief Complaint
* r2: History of Present Illness
* r3: Past Medical History
* r4: Family History
* r5: Physical Examination
* r6: Pertinent Results
### Detailed Analysis or Content Details
The diagram shows the following flow:
1. **Clinical Note to Narrowing-down:** The Clinical Note feeds into the "Narrowing-down" process.
2. **Narrowing-down to Perception:** The "Narrowing-down" process feeds into "Perception".
3. **Perception to Observations & Diagnostic KG:** "Perception" branches out to both the "Observations" box and the "Diagnostic KG".
4. **Observations & Diagnostic KG to Reasoning:** Both "Observations" and "Diagnostic KG" feed into the first "Reasoning" box.
5. **Reasoning to Rationale:** The first "Reasoning" box outputs to the "Rationale" box.
6. **Rationale to Reasoning (Cyclical):** The "Rationale" box feeds back into a second "Reasoning" box, creating a loop.
**Observations List:**
1. Elevated blood pressures
2. CXR showed mild pulmonary edema
3. CHF/Cardiomyopathy
4. Severe LV diastolic dysfunction
5. BPs: 148/98, 156/93
6. ...... (indicating more observations exist)
**Diagnostic KG:**
The KG consists of 5 nodes labeled a1 through a5, interconnected by lines.
**Rationale:**
The "Rationale" box contains a visual representation of connections between the 5 observations (labeled 1-5) and 5 rationale points (labeled a1-a5). The connections are represented by dashed lines. The arrangement of the rationale points appears to change between the first and second "Reasoning" boxes.
### Key Observations
* The process is iterative, as indicated by the cyclical arrow between the "Rationale" and "Reasoning" boxes.
* Both observations from the clinical note and the Diagnostic KG contribute to the reasoning process.
* The "Rationale" box visually represents the connections between observations and rationale points, suggesting a network of evidence supporting a diagnosis.
* The "......" in the Observations list indicates that the list is not exhaustive.
### Interpretation
This diagram depicts a system for clinical decision support. It highlights the importance of distilling information from a complex clinical note ("Narrowing-down" and "Perception") and integrating it with existing medical knowledge ("Diagnostic KG"). The iterative reasoning process suggests that the system refines its understanding and rationale based on the evidence. The connections in the "Rationale" box likely represent the strength or relevance of each observation to a potential diagnosis. The diagram emphasizes a structured approach to clinical reasoning, moving from raw data to a justified conclusion. The cyclical nature of the reasoning process suggests a continuous learning and refinement loop. The diagram does not provide specific data or numerical values, but rather illustrates a conceptual workflow.