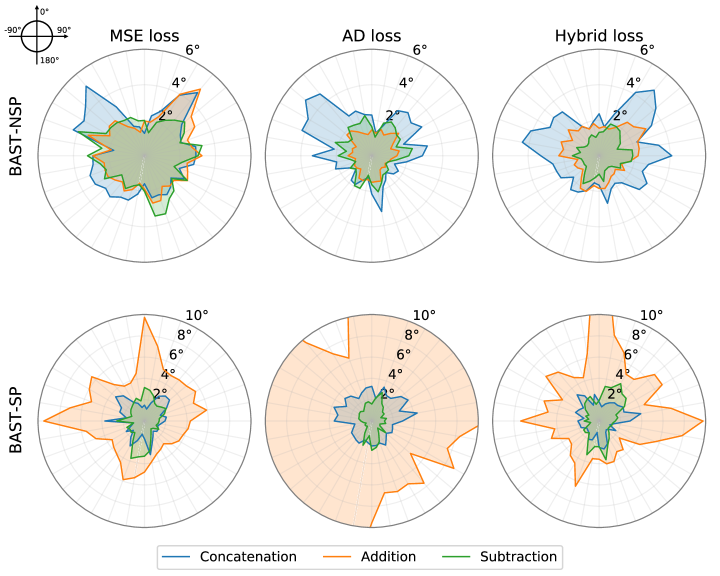
## Radar Charts: Loss Function Performance Comparison
### Overview
The image contains six radar charts comparing the performance of two models (**BAST-NSP** and **BAST-SP**) across three loss functions (**MSE loss**, **AD loss**, **Hybrid loss**). Each chart visualizes angular distributions (0°–180°) for three methods: **Concatenation** (blue), **Addition** (orange), and **Subtraction** (green). Values are represented as angular deviations (e.g., 2°, 4°, 6°).
### Components/Axes
- **X-axis**: Angular positions (0°, 90°, 180°, etc.), labeled in 90° increments.
- **Y-axis**: Angular deviation values (2°, 4°, 6°, 8°, 10°), increasing clockwise.
- **Legend**: Located at the bottom, mapping colors to methods:
- Blue = Concatenation
- Orange = Addition
- Green = Subtraction
- **Chart Titles**:
- Top row: MSE loss, AD loss, Hybrid loss (BAST-NSP)
- Bottom row: MSE loss, AD loss, Hybrid loss (BAST-SP)
### Detailed Analysis
#### MSE Loss (BAST-NSP)
- **Concatenation (blue)**: Peaks at 0° (~6°), 90° (~4°), and 180° (~2°).
- **Addition (orange)**: Peaks at 0° (~4°), 90° (~2°), and 180° (~2°).
- **Subtraction (green)**: Peaks at 0° (~2°), 90° (~2°), and 180° (~2°).
#### AD Loss (BAST-NSP)
- **Concatenation (blue)**: Peaks at 0° (~6°), 90° (~4°), and 180° (~2°).
- **Addition (orange)**: Peaks at 0° (~4°), 90° (~2°), and 180° (~2°).
- **Subtraction (green)**: Peaks at 0° (~2°), 90° (~2°), and 180° (~2°).
#### Hybrid Loss (BAST-NSP)
- **Concatenation (blue)**: Peaks at 0° (~6°), 90° (~4°), and 180° (~2°).
- **Addition (orange)**: Peaks at 0° (~4°), 90° (~2°), and 180° (~2°).
- **Subtraction (green)**: Peaks at 0° (~2°), 90° (~2°), and 180° (~2°).
#### MSE Loss (BAST-SP)
- **Concatenation (blue)**: Peaks at 0° (~10°), 90° (~8°), and 180° (~6°).
- **Addition (orange)**: Peaks at 0° (~8°), 90° (~6°), and 180° (~4°).
- **Subtraction (green)**: Peaks at 0° (~6°), 90° (~4°), and 180° (~2°).
#### AD Loss (BAST-SP)
- **Concatenation (blue)**: Peaks at 0° (~10°), 90° (~8°), and 180° (~6°).
- **Addition (orange)**: Peaks at 0° (~8°), 90° (~6°), and 180° (~4°).
- **Subtraction (green)**: Peaks at 0° (~6°), 90° (~4°), and 180° (~2°).
#### Hybrid Loss (BAST-SP)
- **Concatenation (blue)**: Peaks at 0° (~10°), 90° (~8°), and 180° (~6°).
- **Addition (orange)**: Peaks at 0° (~8°), 90° (~6°), and 180° (~4°).
- **Subtraction (green)**: Peaks at 0° (~6°), 90° (~4°), and 180° (~2°).
### Key Observations
1. **BAST-SP vs. BAST-NSP**: BAST-SP consistently shows higher angular deviations across all loss functions and methods.
2. **Method Performance**:
- **Concatenation** (blue) dominates in magnitude for both models.
- **Addition** (orange) and **Subtraction** (green) show diminishing returns, with Subtraction having the smallest deviations.
3. **Loss Function Impact**:
- **MSE loss** and **AD loss** exhibit similar patterns, while **Hybrid loss** appears slightly more balanced.
- BAST-SP’s deviations are ~2–3× larger than BAST-NSP’s, suggesting higher sensitivity or variability.
### Interpretation
The data suggests that **BAST-SP** is more sensitive to angular deviations than **BAST-NSP**, with all methods showing amplified performance in the former. The **Concatenation** method consistently yields the highest deviations, potentially indicating overfitting or aggressive modeling. The **Hybrid loss** may mitigate extreme deviations compared to standalone MSE/AD losses, though its performance remains tied to the model architecture.
Notably, the **Subtraction** method’s minimal deviations across all scenarios could imply robustness or underutilization of certain features. Further investigation into the Hybrid loss’s composition (e.g., weighting of MSE/AD) might reveal optimization opportunities.