## Bar Chart: Model Performance on Different Tasks
### Overview
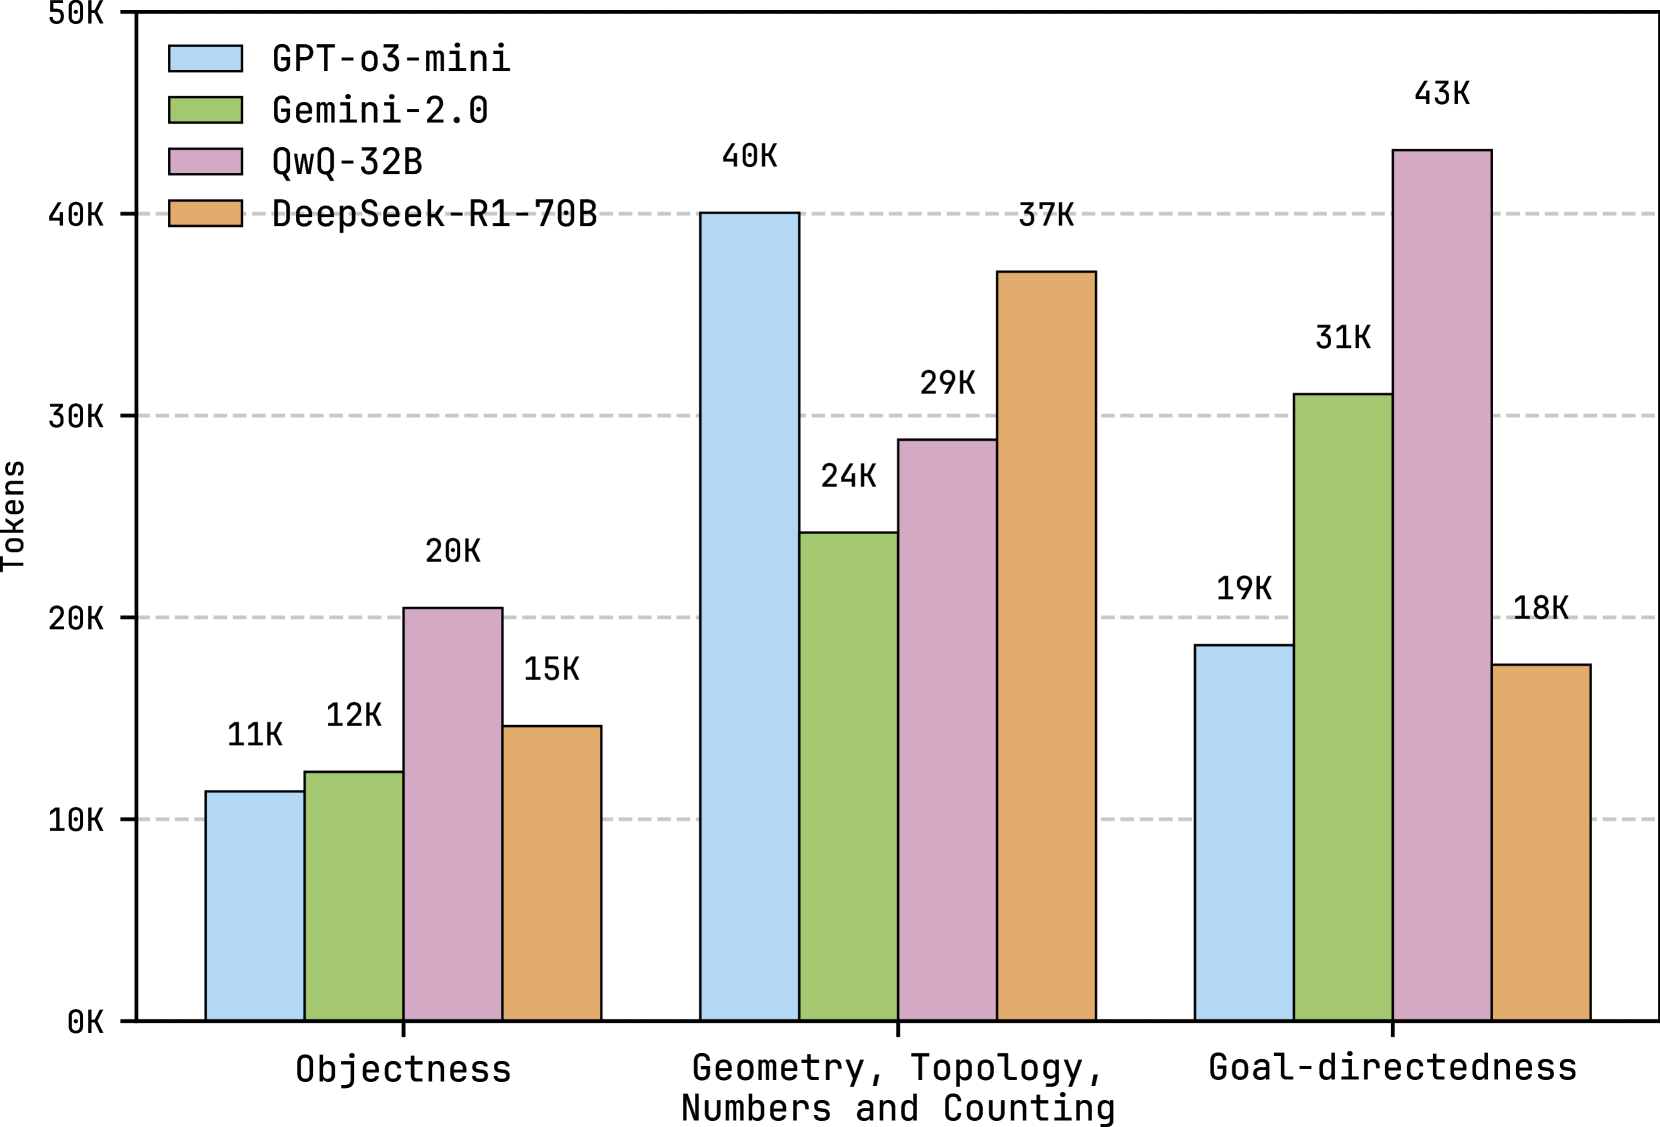
The image is a bar chart comparing the performance of four different language models (GPT-o3-mini, Gemini-2.0, QwQ-32B, and DeepSeek-R1-70B) across three tasks: Objectness, Geometry/Topology/Numbers/Counting, and Goal-directedness. The y-axis represents the number of tokens, ranging from 0K to 50K in increments of 10K. Each task has four bars representing the token count for each model.
### Components/Axes
* **Y-axis:** "Tokens", ranging from 0K to 50K with tick marks at 0K, 10K, 20K, 30K, 40K, and 50K.
* **X-axis:** Categorical axis with three categories: "Objectness", "Geometry, Topology, Numbers and Counting", and "Goal-directedness".
* **Legend:** Located at the top-left of the chart.
* GPT-o3-mini: Light blue bar
* Gemini-2.0: Light green bar
* QwQ-32B: Light purple bar
* DeepSeek-R1-70B: Light orange bar
### Detailed Analysis
Here's a breakdown of the token counts for each model on each task:
* **Objectness:**
* GPT-o3-mini: 11K
* Gemini-2.0: 12K
* QwQ-32B: 20K
* DeepSeek-R1-70B: 15K
* **Geometry, Topology, Numbers and Counting:**
* GPT-o3-mini: 40K
* Gemini-2.0: 24K
* QwQ-32B: 29K
* DeepSeek-R1-70B: 37K
* **Goal-directedness:**
* GPT-o3-mini: 19K
* Gemini-2.0: 31K
* QwQ-32B: 43K
* DeepSeek-R1-70B: 18K
### Key Observations
* GPT-o3-mini performs best on Geometry, Topology, Numbers and Counting, with 40K tokens.
* Gemini-2.0 performs best on Goal-directedness, with 31K tokens.
* QwQ-32B performs best on Goal-directedness, with 43K tokens.
* DeepSeek-R1-70B performs best on Geometry, Topology, Numbers and Counting, with 37K tokens.
* QwQ-32B consistently has higher token counts than the other models on Objectness and Goal-directedness.
* GPT-o3-mini has the lowest token count for Goal-directedness.
### Interpretation
The bar chart illustrates the varying strengths of different language models across different tasks. QwQ-32B seems to excel in tasks related to objectness and goal-directedness, while GPT-o3-mini shows a relative advantage in geometry, topology, numbers, and counting. The data suggests that the models have been trained or are better suited for specific types of tasks. The differences in token counts could reflect the complexity of the tasks for each model or the models' inherent biases.