\n
## Chart: Training Batch Accuracy (%)
### Overview
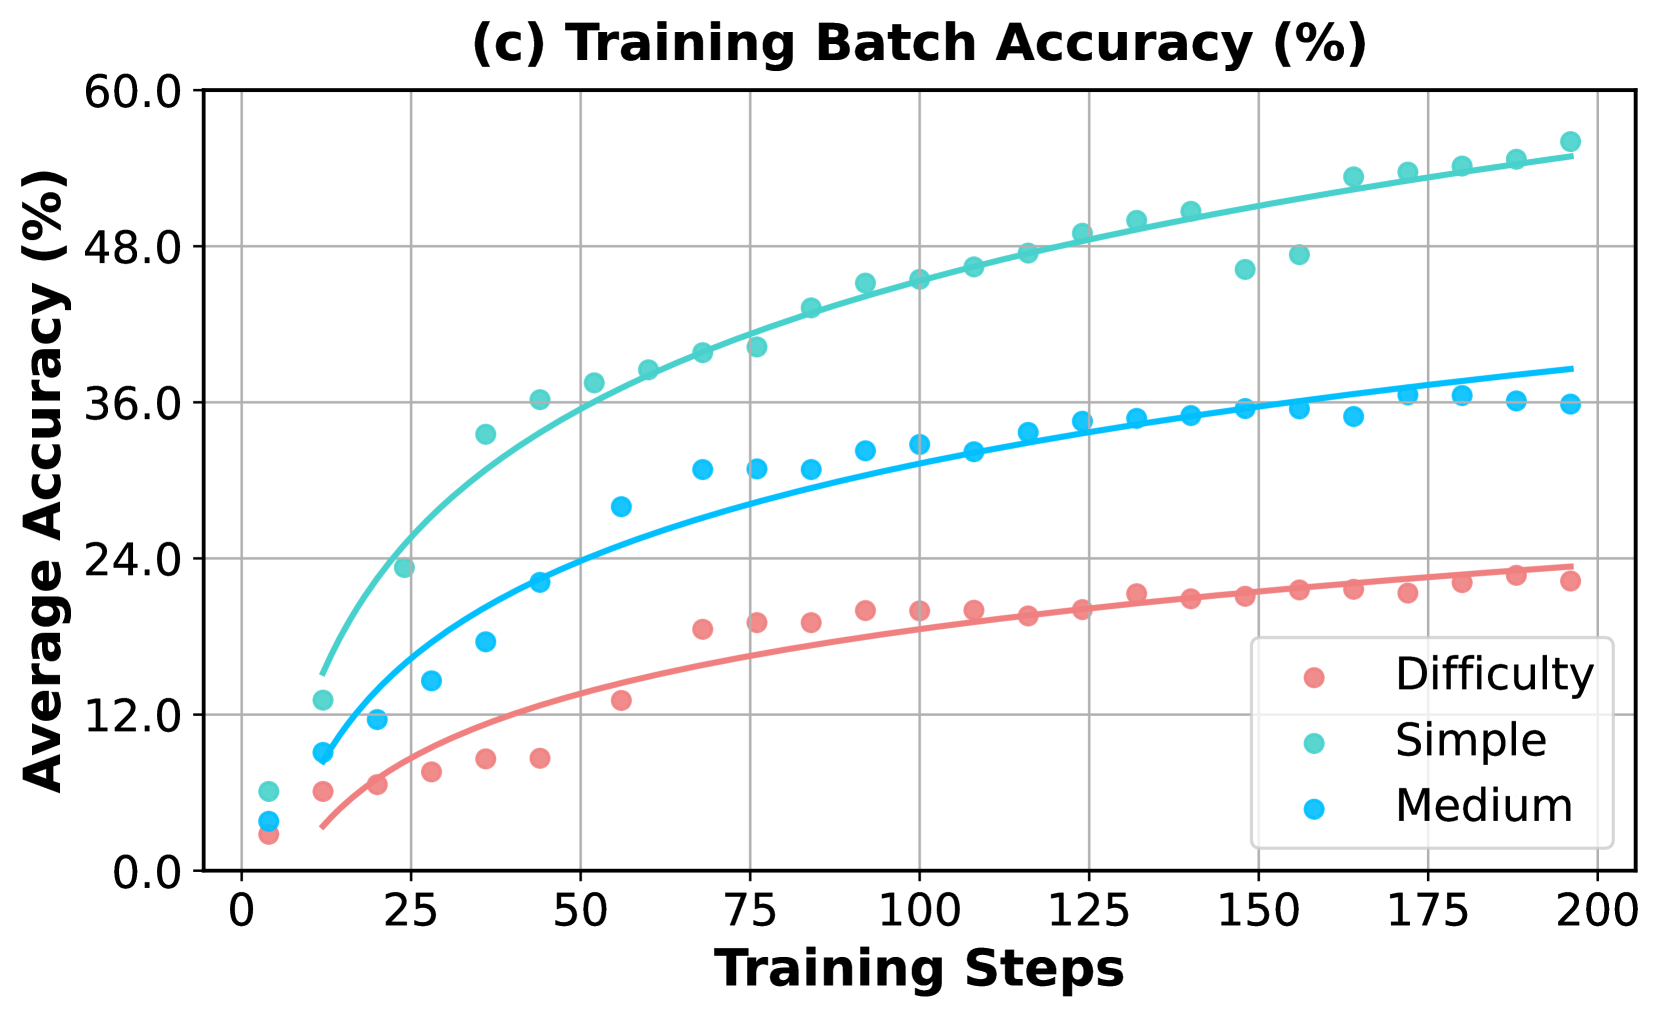
The image presents a line chart illustrating the average accuracy (%) of training batches over training steps for three different difficulty levels: Difficulty, Simple, and Medium. The chart aims to demonstrate how accuracy changes with the number of training steps for each difficulty setting.
### Components/Axes
* **Title:** (c) Training Batch Accuracy (%) - positioned at the top-center.
* **X-axis:** Training Steps - ranging from 0 to 200, with markers at intervals of 25.
* **Y-axis:** Average Accuracy (%) - ranging from 0 to 60, with markers at intervals of 12.
* **Legend:** Located in the bottom-right corner, identifying the data series:
* Difficulty (represented by a red circle)
* Simple (represented by a teal circle)
* Medium (represented by a blue circle)
* **Gridlines:** Present to aid in reading values.
### Detailed Analysis
The chart displays three distinct lines representing the accuracy trends for each difficulty level.
**1. Difficulty (Red Line):**
* The line starts at approximately 2% accuracy at 0 training steps.
* It exhibits a slow, almost linear increase, reaching approximately 22% accuracy at 200 training steps.
* Data points (approximate):
* 0 Steps: 2%
* 25 Steps: 6%
* 50 Steps: 10%
* 75 Steps: 14%
* 100 Steps: 17%
* 125 Steps: 20%
* 150 Steps: 21%
* 175 Steps: 22%
* 200 Steps: 22%
**2. Simple (Teal Line):**
* The line begins at approximately 4% accuracy at 0 training steps.
* It shows a moderate, upward sloping trend, reaching approximately 36% accuracy at 200 training steps.
* Data points (approximate):
* 0 Steps: 4%
* 25 Steps: 12%
* 50 Steps: 20%
* 75 Steps: 27%
* 100 Steps: 31%
* 125 Steps: 33%
* 150 Steps: 34%
* 175 Steps: 35%
* 200 Steps: 36%
**3. Medium (Blue Line):**
* The line starts at approximately 1% accuracy at 0 training steps.
* It demonstrates the steepest upward slope, reaching approximately 49% accuracy at 200 training steps.
* Data points (approximate):
* 0 Steps: 1%
* 25 Steps: 10%
* 50 Steps: 24%
* 75 Steps: 33%
* 100 Steps: 38%
* 125 Steps: 41%
* 150 Steps: 44%
* 175 Steps: 47%
* 200 Steps: 49%
### Key Observations
* The "Medium" difficulty level consistently exhibits the highest accuracy throughout the training process.
* The "Difficulty" level shows the lowest accuracy and the slowest rate of improvement.
* The "Simple" level falls between the other two, demonstrating a moderate improvement in accuracy.
* All three lines show diminishing returns in accuracy as the number of training steps increases, suggesting a potential plateau.
### Interpretation
The chart suggests that the difficulty of the training task significantly impacts the rate at which accuracy improves. More difficult tasks ("Difficulty") require more training steps to achieve comparable accuracy levels to simpler tasks ("Medium"). The steep slope of the "Medium" line indicates that the model learns more effectively on this difficulty level, potentially due to a better balance between challenge and solvability. The plateauing of all lines suggests that further training may not yield substantial improvements in accuracy, and that other factors (e.g., model architecture, hyperparameters) may need to be adjusted to achieve higher performance. The data implies that the model is learning, but the learning rate is decreasing over time. This is a common phenomenon in machine learning and can be addressed with techniques like learning rate scheduling.