## Line Chart: Training Batch Accuracy (%) by Task Difficulty
### Overview
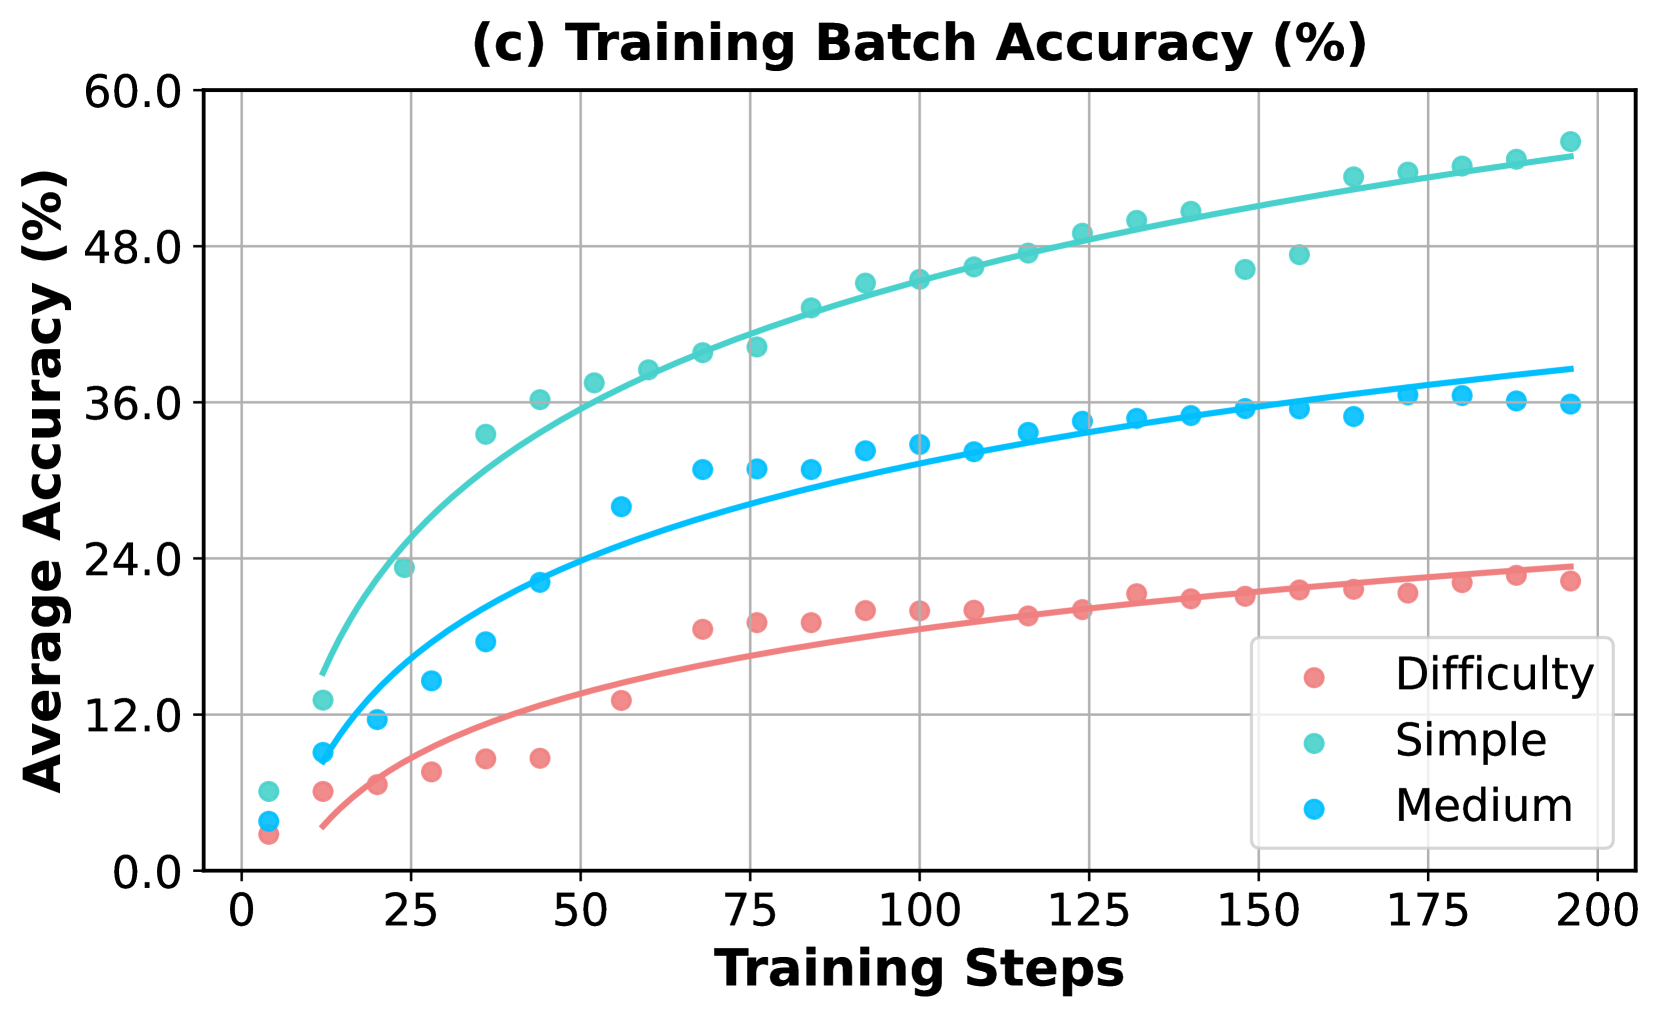
This image is a line chart titled "(c) Training Batch Accuracy (%)". It plots the average accuracy (in percentage) of a machine learning model against the number of training steps. The chart compares the model's performance on three distinct categories of task difficulty: Simple, Medium, and Difficulty (presumably "Hard"). The data is presented as scatter points with fitted trend lines for each category.
### Components/Axes
* **Chart Title:** "(c) Training Batch Accuracy (%)" (Top center)
* **Y-Axis:**
* **Label:** "Average Accuracy (%)" (Left side, rotated vertically)
* **Scale:** Linear scale from 0.0 to 60.0.
* **Major Ticks:** 0.0, 12.0, 24.0, 36.0, 48.0, 60.0.
* **X-Axis:**
* **Label:** "Training Steps" (Bottom center)
* **Scale:** Linear scale from 0 to 200.
* **Major Ticks:** 0, 25, 50, 75, 100, 125, 150, 175, 200.
* **Legend:** Located in the bottom-right quadrant of the chart area.
* **Title:** "Difficulty"
* **Series 1:** "Simple" - Represented by teal/turquoise colored circles and a matching trend line.
* **Series 2:** "Medium" - Represented by bright blue colored circles and a matching trend line.
* **Series 3:** "Difficulty" - Represented by salmon/pink colored circles and a matching trend line.
* **Grid:** A light gray grid is present, aligning with the major ticks on both axes.
### Detailed Analysis
The chart shows three distinct learning curves, all exhibiting a logarithmic growth pattern (rapid initial improvement that gradually plateaus).
**1. Simple Tasks (Teal/Turquoise Series):**
* **Trend:** Shows the steepest initial ascent and achieves the highest overall accuracy.
* **Key Data Points (Approximate):**
* Step 0: ~6%
* Step 25: ~24%
* Step 50: ~36%
* Step 100: ~46%
* Step 150: ~50% (Note: A data point at step ~150 dips to ~47%, slightly below the trend line)
* Step 200: ~55%
* **Trend Line:** Starts near 0% and curves upward, approaching ~55% at step 200.
**2. Medium Tasks (Bright Blue Series):**
* **Trend:** Shows moderate initial growth, consistently performing below the Simple tasks but above the Difficulty tasks.
* **Key Data Points (Approximate):**
* Step 0: ~4%
* Step 25: ~14%
* Step 50: ~22%
* Step 100: ~32%
* Step 150: ~35%
* Step 200: ~36%
* **Trend Line:** Starts near 0% and curves upward, approaching ~38% at step 200.
**3. Difficulty Tasks (Salmon/Pink Series):**
* **Trend:** Shows the slowest rate of improvement and the lowest overall accuracy.
* **Key Data Points (Approximate):**
* Step 0: ~3%
* Step 25: ~8%
* Step 50: ~13%
* Step 100: ~19%
* Step 150: ~22%
* Step 200: ~23%
* **Trend Line:** Starts near 0% and curves upward, approaching ~24% at step 200.
### Key Observations
1. **Clear Performance Hierarchy:** There is a strict and consistent ordering of performance: Simple > Medium > Difficulty at every measured training step after the initial points.
2. **Diminishing Returns:** All three curves demonstrate diminishing returns. The most significant accuracy gains occur within the first 50-75 training steps. After step 100, the rate of improvement slows considerably for all categories.
3. **Convergence Gap:** The performance gap between the categories remains substantial throughout training. At step 200, the model is approximately 19 percentage points more accurate on Simple tasks than on Difficulty tasks.
4. **Data Variance:** The scatter of data points around the trend lines appears relatively low, suggesting consistent performance within each difficulty category at each evaluation step. The most notable outlier is a single "Simple" data point around step 150 that falls below its trend line.
### Interpretation
This chart visualizes a fundamental principle in machine learning: task complexity directly impacts learning efficiency and final model performance. The data suggests that the model finds it significantly easier to learn patterns associated with "Simple" tasks, achieving high accuracy quickly. "Medium" tasks require more training to reach a moderate level of proficiency. "Difficulty" tasks present a substantial challenge, with the model showing slow, incremental learning that plateaus at a much lower accuracy ceiling.
The consistent logarithmic growth indicates that the model is successfully learning from the training data across all difficulties, but its capacity or the information content of the data limits its ultimate performance on harder tasks. The persistent performance gap implies that simply increasing training steps (beyond 200) may yield only marginal improvements, especially for the Difficulty category. To improve performance on harder tasks, one might need to consider changes to the model architecture, training data quality/quantity, or learning algorithms, rather than just extended training.