## Bar Chart: Mean Accuracy by Mathematical Concept
### Overview
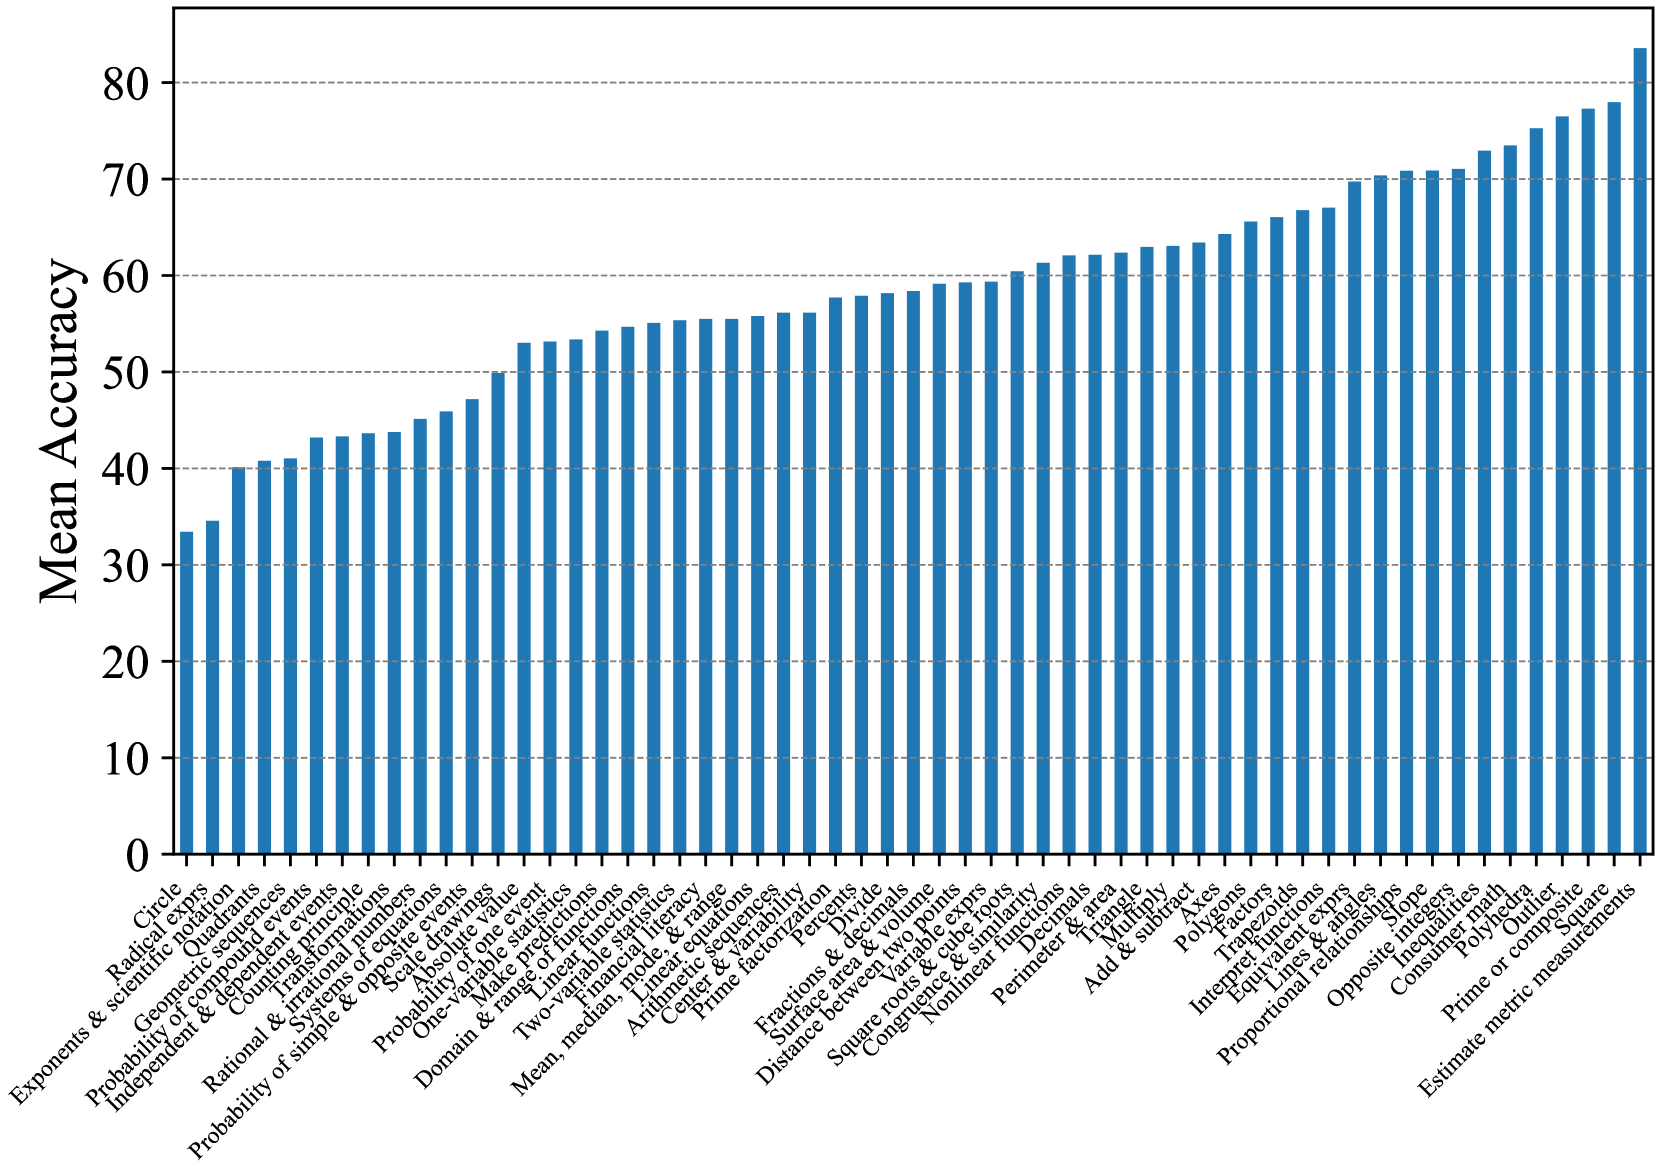
The image is a bar chart displaying the mean accuracy achieved on various mathematical concepts. The x-axis represents different mathematical topics, while the y-axis represents the mean accuracy, ranging from 0 to 80. The chart uses blue bars to represent the accuracy for each concept, sorted in ascending order.
### Components/Axes
* **Y-axis:** "Mean Accuracy", ranging from 0 to 80, with tick marks at intervals of 10.
* **X-axis:** Mathematical concepts, listed horizontally. The labels are somewhat overlapping due to space constraints.
* **Bars:** Blue bars representing the mean accuracy for each mathematical concept.
### Detailed Analysis
The bar chart presents the mean accuracy for a range of mathematical concepts. The concepts are listed along the x-axis, and the corresponding mean accuracy is indicated by the height of the blue bars. The bars are arranged in ascending order of accuracy.
Here's a breakdown of the approximate accuracy for some of the concepts:
* **Circle:** Approximately 34
* **Radical exprs:** Approximately 35
* **Exponents & scientific notation:** Approximately 39
* **Quadrants:** Approximately 40
* **Geometric sequences:** Approximately 41
* **Probability of compound events:** Approximately 42
* **Independent & dependent events:** Approximately 43
* **Rational & irrational numbers:** Approximately 43
* **Probability of simple & opposite events:** Approximately 44
* **Systems of equations:** Approximately 45
* **Scale drawings:** Approximately 46
* **Absolute value:** Approximately 47
* **Make predictions:** Approximately 48
* **One-variable statistics:** Approximately 49
* **Domain & range of functions:** Approximately 50
* **Two-variable functions:** Approximately 51
* **Linear functions:** Approximately 52
* **Arithmetic sequences:** Approximately 53
* **Mean, median, mode, & range:** Approximately 53
* **Financial literacy:** Approximately 54
* **Center & variability:** Approximately 55
* **Prime factorization:** Approximately 56
* **Percents:** Approximately 57
* **Divide:** Approximately 57
* **Fractions & decimals:** Approximately 58
* **Surface area & volume:** Approximately 59
* **Distance between two points:** Approximately 60
* **Square roots & cube roots:** Approximately 61
* **Congruence & similarity:** Approximately 62
* **Nonlinear functions:** Approximately 62
* **Variable exprs:** Approximately 63
* **Perimeter & area:** Approximately 64
* **Triangle:** Approximately 65
* **Add & subtract:** Approximately 66
* **Multiply:** Approximately 66
* **Decimals:** Approximately 67
* **Axes:** Approximately 68
* **Polygons:** Approximately 69
* **Factors:** Approximately 70
* **Trapezoids:** Approximately 71
* **Interpret functions:** Approximately 72
* **Lines & angles:** Approximately 73
* **Proportional relationships:** Approximately 74
* **Slope:** Approximately 75
* **Opposite integers:** Approximately 76
* **Inequalities:** Approximately 77
* **Consumer math:** Approximately 78
* **Polyhedra:** Approximately 79
* **Prime or composite:** Approximately 80
* **Square:** Approximately 81
* **Estimate metric measurements:** Approximately 82
The general trend is an upward slope, indicating increasing mean accuracy as we move from left to right along the x-axis.
### Key Observations
* The mean accuracy varies significantly across different mathematical concepts.
* "Estimate metric measurements" has the highest mean accuracy, while "Circle" has the lowest.
* The concepts are sorted by mean accuracy, making it easy to identify the easiest and most challenging topics.
### Interpretation
The bar chart provides insights into the relative difficulty of different mathematical concepts. The data suggests that concepts like "Estimate metric measurements" are well-understood, while concepts like "Circle" pose a greater challenge. This information can be valuable for educators to tailor their teaching strategies and focus on areas where students struggle the most. The arrangement of the bars allows for a quick visual assessment of the relative difficulty of each concept. The wide range of accuracy scores suggests that some concepts build upon others, and a strong foundation in the basics is crucial for mastering more advanced topics.