## Line Chart: Llama-3.2-1B vs Llama-3.2-3B Answer Accuracy
### Overview
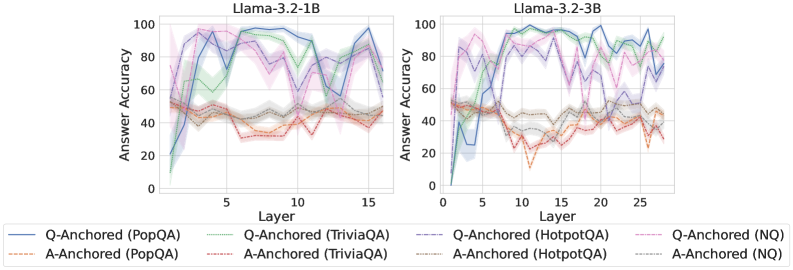
The image presents two line charts comparing the answer accuracy of two language models, Llama-3.2-1B and Llama-3.2-3B, across different layers. Each chart displays six data series, representing "Q-Anchored" and "A-Anchored" performance on various question-answering datasets: PopQA, TriviaQA, HotpotQA, and NQ. The x-axis represents the layer number, and the y-axis represents the answer accuracy in percentage. Shaded regions around each line indicate the uncertainty or variance in the data.
### Components/Axes
* **Titles:**
* Left Chart: Llama-3.2-1B
* Right Chart: Llama-3.2-3B
* **X-axis:**
* Label: Layer
* Left Chart: Scale from 0 to 15, with tick marks at 0, 5, 10, and 15.
* Right Chart: Scale from 0 to 25, with tick marks at 0, 5, 10, 15, 20, and 25.
* **Y-axis:**
* Label: Answer Accuracy
* Scale: 0 to 100, with tick marks at 0, 20, 40, 60, 80, and 100.
* **Legend:** Located at the bottom of the charts.
* Q-Anchored (PopQA): Solid blue line
* A-Anchored (PopQA): Dashed brown line
* Q-Anchored (TriviaQA): Dotted green line
* A-Anchored (TriviaQA): Dashed-dotted pink line
* Q-Anchored (HotpotQA): Solid purple line
* A-Anchored (HotpotQA): Dashed red line
* Q-Anchored (NQ): Dashed-dotted pink line
* A-Anchored (NQ): Dotted gray line
### Detailed Analysis
**Left Chart: Llama-3.2-1B**
* **Q-Anchored (PopQA):** (Solid blue line) Starts around 20% accuracy at layer 0, rises sharply to approximately 90% by layer 5, and then fluctuates between 80% and 100% for the remaining layers.
* **A-Anchored (PopQA):** (Dashed brown line) Starts around 50% accuracy and remains relatively stable between 40% and 50% across all layers.
* **Q-Anchored (TriviaQA):** (Dotted green line) Starts around 60% accuracy, increases to approximately 90% by layer 5, and then fluctuates between 70% and 90% for the remaining layers.
* **A-Anchored (TriviaQA):** (Dashed-dotted pink line) Starts around 50% accuracy and remains relatively stable between 40% and 50% across all layers.
* **Q-Anchored (HotpotQA):** (Solid purple line) Starts around 60% accuracy, increases to approximately 90% by layer 5, and then fluctuates between 80% and 100% for the remaining layers.
* **A-Anchored (HotpotQA):** (Dashed red line) Starts around 50% accuracy and remains relatively stable between 30% and 50% across all layers.
* **Q-Anchored (NQ):** (Dashed-dotted pink line) Starts around 60% accuracy, increases to approximately 90% by layer 5, and then fluctuates between 80% and 100% for the remaining layers.
* **A-Anchored (NQ):** (Dotted gray line) Starts around 50% accuracy and remains relatively stable between 40% and 50% across all layers.
**Right Chart: Llama-3.2-3B**
* **Q-Anchored (PopQA):** (Solid blue line) Starts around 20% accuracy at layer 0, rises sharply to approximately 90% by layer 5, and then fluctuates between 80% and 100% for the remaining layers.
* **A-Anchored (PopQA):** (Dashed brown line) Starts around 50% accuracy and remains relatively stable between 40% and 50% across all layers.
* **Q-Anchored (TriviaQA):** (Dotted green line) Starts around 60% accuracy, increases to approximately 90% by layer 5, and then fluctuates between 70% and 90% for the remaining layers.
* **A-Anchored (TriviaQA):** (Dashed-dotted pink line) Starts around 50% accuracy and remains relatively stable between 40% and 50% across all layers.
* **Q-Anchored (HotpotQA):** (Solid purple line) Starts around 60% accuracy, increases to approximately 90% by layer 5, and then fluctuates between 80% and 100% for the remaining layers.
* **A-Anchored (HotpotQA):** (Dashed red line) Starts around 50% accuracy and remains relatively stable between 30% and 50% across all layers.
* **Q-Anchored (NQ):** (Dashed-dotted pink line) Starts around 60% accuracy, increases to approximately 90% by layer 5, and then fluctuates between 80% and 100% for the remaining layers.
* **A-Anchored (NQ):** (Dotted gray line) Starts around 50% accuracy and remains relatively stable between 40% and 50% across all layers.
### Key Observations
* For both models, "Q-Anchored" performance on PopQA, TriviaQA, HotpotQA, and NQ datasets shows a significant increase in accuracy within the first few layers, reaching high levels of performance (80-100%).
* "A-Anchored" performance on all datasets remains relatively stable and lower (30-50%) across all layers for both models.
* The Llama-3.2-3B model has more layers (25) than the Llama-3.2-1B model (15), but the overall trends in accuracy are similar.
### Interpretation
The data suggests that anchoring the question (Q-Anchored) leads to significantly better answer accuracy compared to anchoring the answer (A-Anchored) for both Llama-3.2-1B and Llama-3.2-3B models across various question-answering datasets. The rapid increase in accuracy for Q-Anchored tasks within the initial layers indicates that the models quickly learn to leverage question-related information for improved performance. The relatively constant and lower accuracy for A-Anchored tasks suggests that the models struggle to effectively utilize answer-related information in the same way. The similarity in trends between the two models, despite the difference in the number of layers, implies that the core learning dynamics are consistent, and the additional layers in Llama-3.2-3B do not drastically alter the overall performance patterns.