## Heatmap: Audio Feature Analysis Across Strength Levels
### Overview
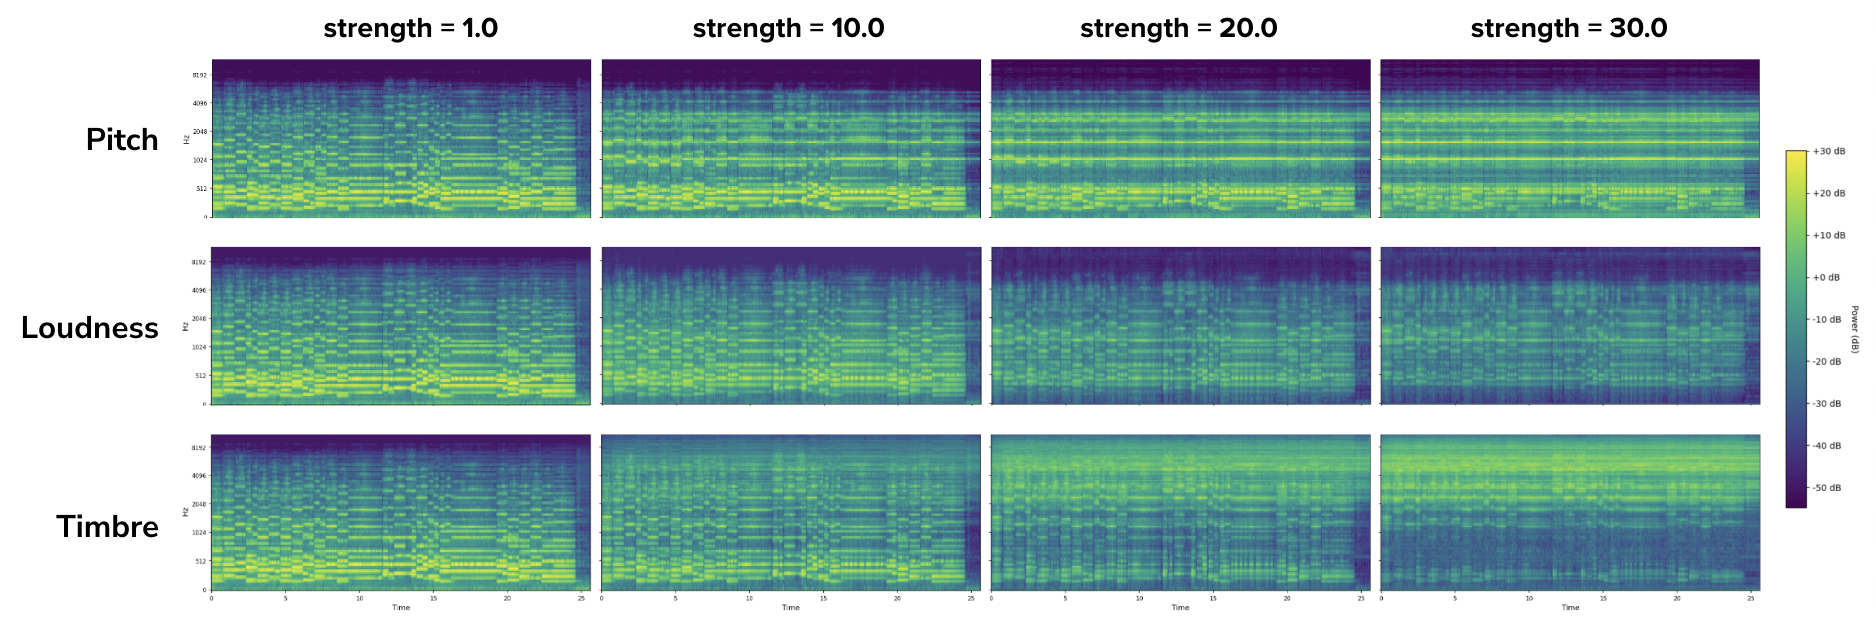
The image displays a comparative heatmap analysis of three audio features (Pitch, Loudness, Timbre) across four strength levels (1.0, 10.0, 20.0, 30.0). Each panel visualizes power distribution (in dB) across time (0-25s) and frequency (122-9132 Hz). Color intensity corresponds to power levels, with darker blues indicating lower values and brighter yellows representing higher values.
### Components/Axes
- **X-axis (Time):** 0-25 seconds, labeled "Time" in all panels.
- **Y-axis (Frequency):** 122-9132 Hz, labeled "Frequency" in all panels.
- **Legend:** Vertical colorbar on the right, ranging from -50 dB (dark blue) to +30 dB (bright yellow).
- **Panels:** Four columns labeled "strength = 1.0", "strength = 10.0", "strength = 20.0", and "strength = 30.0".
- **Rows:** Three rows labeled "Pitch", "Loudness", and "Timbre".
### Detailed Analysis
#### Pitch Row
- **Strength = 1.0:** Horizontal bands of alternating yellow/green (10-20 dB) dominate, with occasional blue streaks (-10 dB). Frequency range shows consistent activity.
- **Strength = 10.0:** Bands become denser, with yellow regions extending to ~+20 dB. Blue streaks reduce in frequency.
- **Strength = 20.0:** Yellow bands occupy ~70% of the panel, reaching +25 dB. Blue regions nearly disappear.
- **Strength = 30.0:** Uniform yellow across most frequencies, peaking at +30 dB. Only minor blue patches remain at the top.
#### Loudness Row
- **Strength = 1.0:** Vertical streaks of yellow/green (10-20 dB) appear sporadically. Most of the panel is dark blue (-30 dB).
- **Strength = 10.0:** Streaks increase in density, with yellow regions reaching ~+15 dB. Dark blue areas reduce to ~40%.
- **Strength = 20.0:** Vertical yellow streaks dominate (~80% coverage), peaking at +20 dB. Blue regions concentrate at the bottom.
- **Strength = 30.0:** Nearly uniform yellow across all frequencies, with +30 dB peaks. Blue regions are confined to the top 10% of the frequency range.
#### Timbre Row
- **Strength = 1.0:** Scattered yellow/green dots (10-20 dB) on a dark blue background. No clear pattern.
- **Strength = 10.0:** Dots cluster into horizontal bands, with yellow regions reaching ~+15 dB. Dark blue areas reduce to ~60%.
- **Strength = 20.0:** Bands merge into larger blocks, with yellow regions covering ~50% of the panel. Peaks at +25 dB.
- **Strength = 30.0:** Large contiguous yellow blocks dominate (~75% coverage), with +30 dB peaks. Blue regions are minimal.
### Key Observations
1. **Strength Correlation:** Higher strength levels consistently increase power (dB) across all features.
2. **Feature Patterns:**
- **Pitch:** Horizontal bands suggest sustained frequency components.
- **Loudness:** Vertical streaks indicate transient events or rhythmic patterns.
- **Timbre:** Scattered dots evolve into blocky structures, implying harmonic complexity.
3. **Color Consistency:** Yellow regions (high dB) align with the legend’s +30 dB threshold in all panels.
4. **Temporal Progression:** Patterns become more pronounced and dense as strength increases.
### Interpretation
The data demonstrates that increasing strength amplifies specific audio characteristics:
- **Pitch** exhibits harmonic resonance, with higher strengths producing sustained tonal bands.
- **Loudness** shows rhythmic or percussive elements, with vertical streaks becoming continuous at maximum strength.
- **Timbre** transitions from random noise to structured harmonic content, suggesting increased complexity.
Notably, the dB scale reveals that higher strengths concentrate power in specific frequency ranges, particularly for Pitch and Loudness. The Timbre feature’s evolution from scattered dots to blocks implies a shift from dissonance to harmonic coherence. These patterns could reflect how audio processing algorithms prioritize features at different amplification levels.