## Line Chart: Accuracy vs. Thinking Compute
### Overview
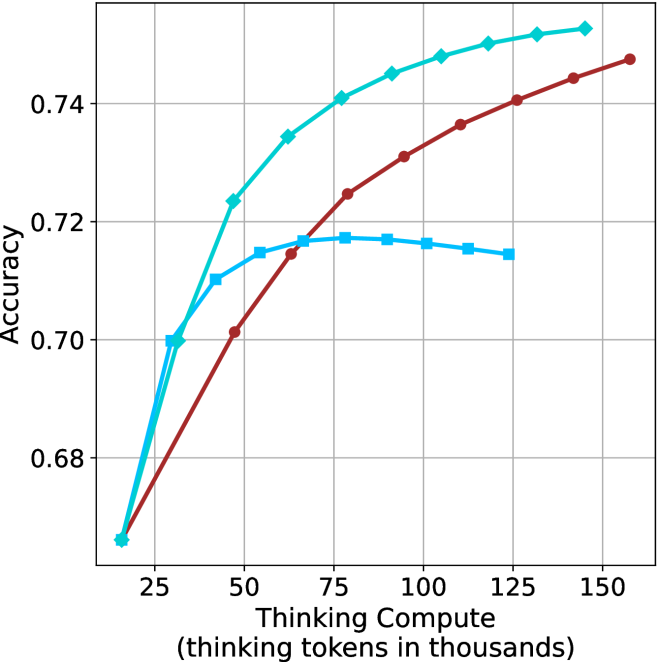
The image is a line chart comparing accuracy against "Thinking Compute" (measured in thousands of thinking tokens). There are three distinct data series represented by lines of different colors: brown, light blue with diamond markers, and light blue with square markers. The chart shows how accuracy changes as "Thinking Compute" increases.
### Components/Axes
* **X-axis:** "Thinking Compute (thinking tokens in thousands)". The scale ranges from approximately 20 to 160, with tick marks at intervals of 25.
* **Y-axis:** "Accuracy". The scale ranges from 0.68 to 0.74, with tick marks at intervals of 0.02.
* **Data Series:**
* Brown line with circle markers.
* Light blue line with diamond markers.
* Light blue line with square markers.
### Detailed Analysis
* **Brown Line (Circle Markers):**
* Trend: The brown line slopes upward, indicating an increase in accuracy as "Thinking Compute" increases. The rate of increase appears to slow down as "Thinking Compute" gets larger.
* Data Points:
* At Thinking Compute = 25, Accuracy ≈ 0.67
* At Thinking Compute = 50, Accuracy ≈ 0.70
* At Thinking Compute = 75, Accuracy ≈ 0.72
* At Thinking Compute = 100, Accuracy ≈ 0.735
* At Thinking Compute = 125, Accuracy ≈ 0.74
* At Thinking Compute = 150, Accuracy ≈ 0.75
* **Light Blue Line (Diamond Markers):**
* Trend: The light blue line with diamond markers slopes upward, indicating an increase in accuracy as "Thinking Compute" increases. The rate of increase slows down as "Thinking Compute" gets larger.
* Data Points:
* At Thinking Compute = 25, Accuracy ≈ 0.67
* At Thinking Compute = 50, Accuracy ≈ 0.725
* At Thinking Compute = 75, Accuracy ≈ 0.74
* At Thinking Compute = 100, Accuracy ≈ 0.75
* At Thinking Compute = 125, Accuracy ≈ 0.755
* **Light Blue Line (Square Markers):**
* Trend: The light blue line with square markers initially slopes upward, reaches a peak, and then slopes downward.
* Data Points:
* At Thinking Compute = 25, Accuracy ≈ 0.70
* At Thinking Compute = 50, Accuracy ≈ 0.715
* At Thinking Compute = 75, Accuracy ≈ 0.717
* At Thinking Compute = 100, Accuracy ≈ 0.717
* At Thinking Compute = 125, Accuracy ≈ 0.714
### Key Observations
* The light blue line with diamond markers consistently shows higher accuracy than the brown line across the range of "Thinking Compute" values.
* The light blue line with square markers reaches a plateau and then declines, suggesting a point of diminishing returns or potential overfitting.
* All three lines show a significant increase in accuracy between "Thinking Compute" values of 25 and 75.
### Interpretation
The chart suggests that increasing "Thinking Compute" generally leads to higher accuracy, but the relationship is not always linear. The light blue line with diamond markers demonstrates the highest accuracy gains with increasing "Thinking Compute", while the brown line shows a more gradual increase. The light blue line with square markers indicates that there may be a point where increasing "Thinking Compute" no longer improves accuracy and may even decrease it. This could be due to factors such as overfitting or the model reaching its capacity. The data implies that the optimal "Thinking Compute" level depends on the specific model or configuration being used. Further investigation would be needed to understand the specific characteristics of each data series and the reasons for their different performance trends.