## Line Graph: LM Loss vs. PFlOP/s-days for MoBA and Full Attention Projections
### Overview
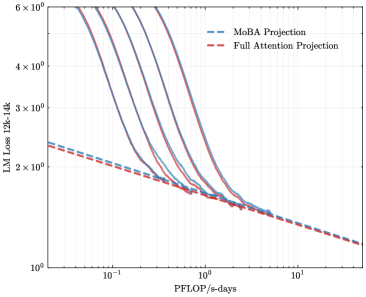
The image is a logarithmic line graph comparing two computational projections: "MoBA Projection" (blue dashed line) and "Full Attention Projection" (red dashed line). The graph illustrates how the language model (LM) loss (measured in 12k-14k tokens) decreases as a function of processing power (PFlOP/s-days). Both lines exhibit exponential decay trends, with the MoBA Projection starting higher but decreasing more steeply than the Full Attention Projection.
### Components/Axes
- **X-axis (Horizontal)**: Labeled "PFlOP/s-days" with a logarithmic scale ranging from 10⁻¹ to 10¹.
- **Y-axis (Vertical)**: Labeled "LM Loss 12k-14k" with a logarithmic scale ranging from 10⁰ to 6×10⁰.
- **Legend**: Located in the top-right corner, associating:
- Blue dashed line → "MoBA Projection"
- Red dashed line → "Full Attention Projection"
### Detailed Analysis
1. **MoBA Projection (Blue Dashed Line)**:
- Starts at approximately 5×10⁰ LM Loss at 10⁻¹ PFlOP/s-days.
- Decreases sharply, crossing the Full Attention Projection line near 10⁰ PFlOP/s-days.
- Ends at ~1.5×10⁰ LM Loss at 10¹ PFlOP/s-days.
2. **Full Attention Projection (Red Dashed Line)**:
- Starts at ~3×10⁰ LM Loss at 10⁻¹ PFlOP/s-days.
- Decreases more gradually, remaining above the MoBA Projection until ~10⁰ PFlOP/s-days.
- Ends at ~1.2×10⁰ LM Loss at 10¹ PFlOP/s-days.
3. **Key Intersection**:
- The two lines intersect at ~10⁰ PFlOP/s-days, where both projections show LM Loss ≈ 2×10⁰.
### Key Observations
- **Initial Disparity**: At low PFlOP/s-days (10⁻¹), MoBA Projection has a 66% higher LM Loss than Full Attention Projection.
- **Convergence**: By 10¹ PFlOP/s-days, both projections achieve similar LM Loss (~1.2–1.5×10⁰), suggesting diminishing returns at scale.
- **Efficiency Tradeoff**: MoBA Projection requires significantly more computational power to achieve comparable loss reduction at lower scales.
### Interpretation
The data suggests that MoBA Projection is less efficient than Full Attention Projection at lower computational scales but catches up as resources increase. The crossover at 10⁰ PFlOP/s-days implies that MoBA Projection may be preferable for high-scale deployments, while Full Attention Projection is more efficient for smaller-scale applications. The convergence at 10¹ PFlOP/s-days indicates that both approaches plateau in performance gains beyond this threshold, highlighting potential limits to scaling benefits.
**Note**: All values are approximate due to the logarithmic scale and lack of explicit data points. Uncertainty in exact values is ~10–20% based on visual estimation.