# Technical Data Extraction: SER vs. Pilot Size Performance Chart
## 1. Image Metadata & Overview
- **Type:** Line Graph (Performance Comparison)
- **Language:** English
- **Primary Subject:** Symbol Error Rate (SER) performance of various signal processing/estimation algorithms relative to Pilot Size.
## 2. Component Isolation
### A. Header/Legend
- **Location:** Top-right quadrant.
- **Legend Items (Color/Style Coded):**
- **Capon:** Solid Green line.
- **Kernel:** Solid Light Blue line.
- **Wiener:** Solid Red line.
- **Wiener-CE:** Dashed Dark Blue line.
- **ZF (Zero Forcing):** Solid Magenta line.
### B. Main Chart Area (Axes)
- **Y-Axis (Vertical):**
- **Label:** SER (Symbol Error Rate)
- **Scale:** 0 to 0.8
- **Markers:** 0, 0.2, 0.4, 0.6, 0.8
- **X-Axis (Horizontal):**
- **Label:** Pilot Size
- **Scale:** 10 to 80 (implied start near 5)
- **Markers:** 20, 40, 60, 80
---
## 3. Trend Verification & Data Extraction
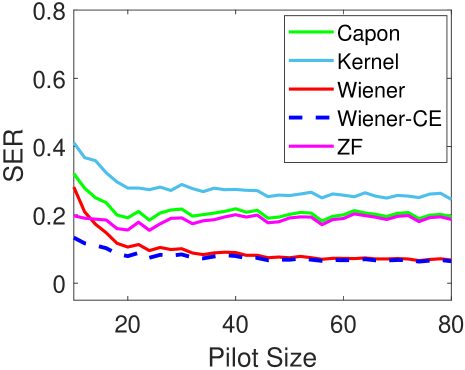
All data series exhibit a "decay and plateau" trend: a sharp decrease in SER as Pilot Size increases from the minimum value, followed by stabilization (convergence) after a Pilot Size of approximately 20-30.
### Data Series Analysis (Ordered by Performance - Lowest SER is Best)
| Algorithm | Line Style | Initial Trend (Pilot Size < 20) | Convergence Level (SER) | Relative Performance |
| :--- | :--- | :--- | :--- | :--- |
| **Wiener-CE** | Dashed Dark Blue | Slopes downward from ~0.14 to ~0.08. | ~0.07 - 0.08 | **Best Overall.** Lowest error rate across all pilot sizes. |
| **Wiener** | Solid Red | Sharp downward slope from ~0.28 to ~0.11. | ~0.07 - 0.09 | Converges to nearly the same level as Wiener-CE after Pilot Size 40. |
| **ZF** | Solid Magenta | Slight downward slope from ~0.20 to ~0.16. | ~0.18 - 0.20 | Mid-tier performance; very stable after initial drop. |
| **Capon** | Solid Green | Sharp downward slope from ~0.32 to ~0.20. | ~0.20 - 0.22 | Slightly worse than ZF; exhibits minor fluctuations. |
| **Kernel** | Solid Light Blue | Downward slope from ~0.42 to ~0.28. | ~0.25 - 0.28 | **Worst Overall.** Highest error rate across the entire range. |
---
## 4. Key Observations & Technical Insights
1. **Convergence Point:** Most algorithms reach a point of diminishing returns regarding Pilot Size around the **20-30 mark**. Increasing the Pilot Size beyond 40 yields negligible improvements in SER for all tested methods.
2. **Wiener Superiority:** Both Wiener-based methods (Wiener and Wiener-CE) significantly outperform the other three methods.
3. **Wiener vs. Wiener-CE:** The "Wiener-CE" (dashed blue) maintains a lower SER at very small pilot sizes compared to the standard "Wiener" (solid red), though they converge to nearly identical values as the pilot size increases.
4. **Stability:** The "Kernel" and "Capon" methods show more visual "jitter" or variance in their SER values across the horizontal axis compared to the smoother "Wiener-CE" line.
5. **Ranking:** At any given Pilot Size (e.g., at x=40), the performance ranking from best to worst is:
* `Wiener-CE ≈ Wiener > ZF > Capon > Kernel`