## BFS-tree
### Overview
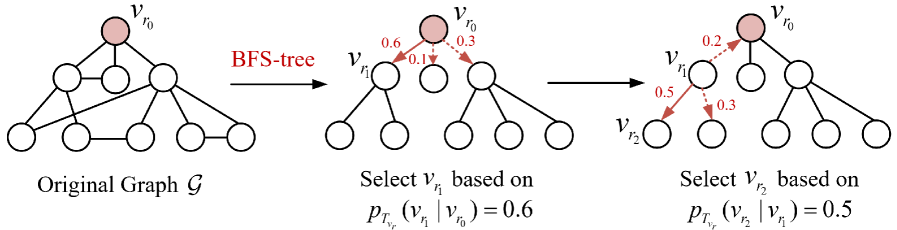
The image depicts a process involving a graph and a BFS-tree. The original graph is shown on the left, with nodes connected by edges. The BFS-tree is constructed on the right, with nodes selected based on certain probabilities.
### Components/Axes
- **Original Graph \( G \)**: A graph with nodes and edges.
- **BFS-tree**: A tree constructed from the original graph, with nodes selected based on probabilities.
- **Nodes**: Represented by circles, with some highlighted in red.
- **Edges**: Lines connecting the nodes.
- **Probability Labels**: Indicate the probability of selecting a node based on its distance from the root.
- **Legend**: Shows the color coding for the nodes in the BFS-tree.
### Detailed Analysis or ### Content Details
- **Original Graph \( G \)**: The graph has 10 nodes, with some nodes connected by edges. The nodes are labeled from 1 to 10.
- **BFS-tree**: The BFS-tree is constructed by selecting nodes based on their distance from the root. The root node is highlighted in red.
- **Probability Labels**: The probability of selecting a node is indicated by the numbers next to the edges. For example, the edge from node 1 to node 2 has a probability of 0.6.
- **Legend**: The legend shows that the nodes in the BFS-tree are colored in red, indicating they have been selected based on the probabilities.
### Key Observations
- **Node Selection**: The nodes are selected based on their distance from the root, with higher probabilities for nodes closer to the root.
- **Probability Distribution**: The probabilities are distributed among the nodes, with some nodes having higher probabilities than others.
- **Tree Structure**: The BFS-tree is a tree structure, with nodes connected in a hierarchical manner.
### Interpretation
The image demonstrates the process of constructing a BFS-tree from an original graph. The BFS-tree is constructed by selecting nodes based on their distance from the root, with higher probabilities for nodes closer to the root. The probability labels indicate the likelihood of selecting a node based on its distance from the root. The legend shows that the nodes in the BFS-tree are colored in red, indicating they have been selected based on the probabilities. The image provides a visual representation of the process and the resulting BFS-tree.