TECHNICAL ASSET FINGERPRINT
9b90feae0d2910ebbd2044b9
Click to view fullscreen
Press ESC or click to close
FOUND IN PAPERS
EXPERT: healer-alpha-free VERSION 1
RUNTIME: free/openrouter/healer-alpha
INTEL_VERIFIED
## Medical Case Analysis Diagram: Clinical Reasoning for Stroke Diagnosis
### Overview
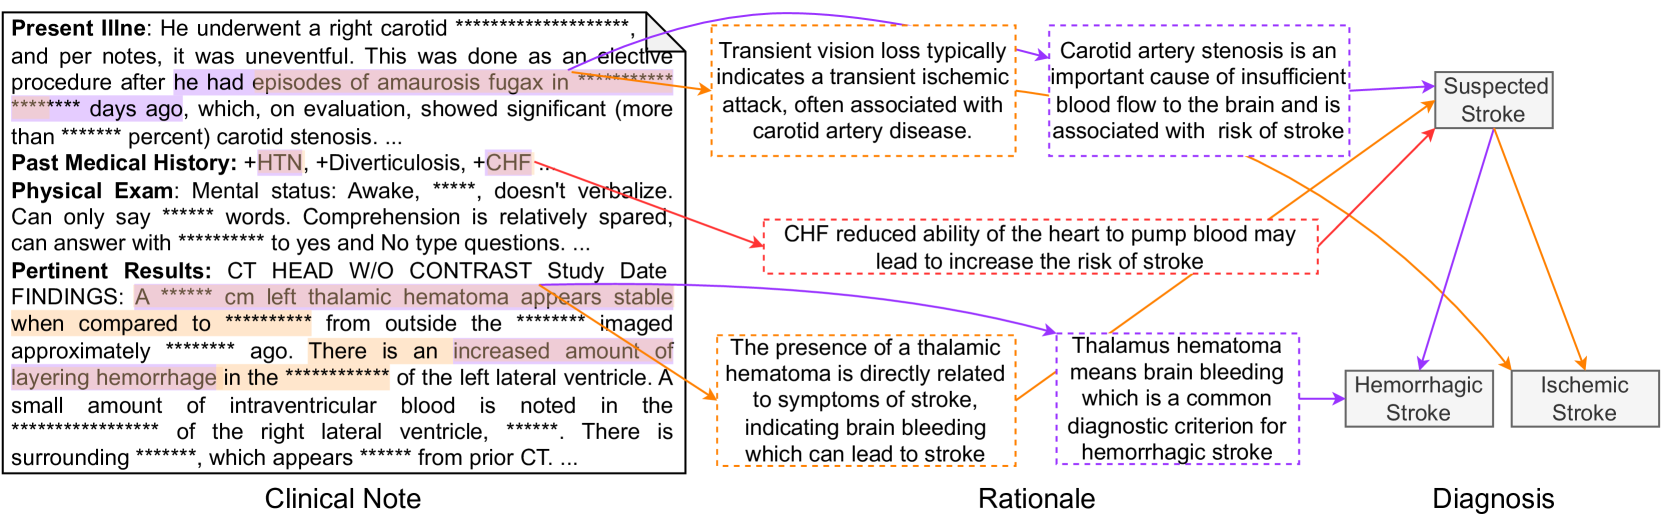
The image is a structured medical reasoning diagram that traces a patient's clinical presentation from a clinical note through a rationale phase to a final diagnostic conclusion. It visually maps how specific findings in a patient's record lead to the suspicion and classification of a stroke. The diagram is divided into three vertical sections: **Clinical Note** (left), **Rationale** (center), and **Diagnosis** (right). Colored arrows connect specific text excerpts to explanatory rationales and then to diagnostic outcomes.
### Components/Axes
The diagram has three primary components arranged left to right:
1. **Clinical Note (Left Panel):** A text box containing excerpts from a patient's medical record. Sections include:
* **Present Illness:** Describes a right carotid procedure and past episodes of *amaurosis fugax* (transient vision loss) due to significant carotid stenosis.
* **Past Medical History:** Lists comorbidities: +HTN (Hypertension), +Diverticulosis, +CHF (Congestive Heart Failure).
* **Physical Exam:** Notes mental status (awake, non-verbal, limited comprehension).
* **Pertinent Results:** Details from a CT HEAD W/O CONTRAST scan, noting a stable left thalamic hematoma and increased layering hemorrhage in the left lateral ventricle.
* *Note: Several specific values (percentages, measurements, dates) are redacted with asterisks (`*`).*
2. **Rationale (Center Panel):** A series of text boxes with dashed borders, each providing a medical explanation linking a clinical finding to a stroke mechanism. These are connected by colored arrows to the source text and to the diagnoses.
* **Orange Dashed Box (Top):** "Transient vision loss typically indicates a transient ischemic attack, often associated with carotid artery disease."
* **Purple Dashed Box (Top):** "Carotid artery stenosis is an important cause of insufficient blood flow to the brain and is associated with risk of stroke."
* **Red Dashed Box (Middle):** "CHF reduced ability of the heart to pump blood may lead to increase the risk of stroke."
* **Orange Dashed Box (Bottom):** "The presence of a thalamic hematoma is directly related to symptoms of stroke, indicating brain bleeding which can lead to stroke."
* **Purple Dashed Box (Bottom):** "Thalamus hematoma means brain bleeding which is a common diagnostic criterion for hemorrhagic stroke."
3. **Diagnosis (Right Panel):** Three solid-bordered boxes representing diagnostic conclusions.
* **Suspected Stroke** (Top)
* **Hemorrhagic Stroke** (Bottom Left)
* **Ischemic Stroke** (Bottom Right)
### Detailed Analysis
**Textual Extraction from Clinical Note:**
* **Present Illness:** "He underwent a right carotid ***************** and per notes, it was uneventful. This was done as an elective procedure after he had episodes of amaurosis fugax in ******** days ago, which, on evaluation, showed significant (more than ****** percent) carotid stenosis. ..."
* **Past Medical History:** "+HTN, +Diverticulosis, +CHF."
* **Physical Exam:** "Mental status: Awake, ****, doesn't verbalize. Can only say ****** words. Comprehension is relatively spared, can answer with ********** to yes and No type questions. ..."
* **Pertinent Results:** "CT HEAD W/O CONTRAST Study Date FINDINGS: A ****** cm left thalamic hematoma appears stable when compared to ********** from outside the ****** imaged approximately ****** ago. There is an increased amount of layering hemorrhage in the *********** of the left lateral ventricle. A small amount of intraventricular blood is noted in the *************** of the right lateral ventricle, ******. There is surrounding *******, which appears ****** from prior CT. ..."
**Arrow Mapping & Logic Flow:**
* **Orange Arrows:** Trace from "amaurosis fugax" and "thalamic hematoma" text to the corresponding orange rationale boxes. These rationales then point to **Ischemic Stroke** (from carotid disease) and **Hemorrhagic Stroke** (from brain bleeding).
* **Purple Arrows:** Trace from "carotid stenosis" and "thalamic hematoma" text to the corresponding purple rationale boxes. These point to **Suspected Stroke** (general risk) and **Hemorrhagic Stroke** (specific criterion).
* **Red Arrow:** Traces from "+CHF" to the red rationale box, which points directly to **Suspected Stroke**.
### Key Observations
1. **Dual Pathways to Diagnosis:** The diagram shows two distinct etiological pathways leading to stroke diagnosis:
* An **ischemic pathway** (orange) originating from carotid artery disease (amaurosis fugax, stenosis).
* A **hemorrhagic pathway** (purple/orange) originating from direct evidence of brain bleeding (thalamic hematoma, intraventricular hemorrhage).
2. **CHF as a General Risk Factor:** Congestive Heart Failure (CHF) is presented not as a direct cause of a specific stroke type, but as a general condition that increases overall stroke risk, leading to the "Suspected Stroke" conclusion.
3. **Anatomical Specificity:** The clinical note specifies a **left thalamic hematoma** and hemorrhage in the **left lateral ventricle**, providing precise anatomical localization for the hemorrhagic event.
4. **Temporal Information:** The note indicates the hematoma is "stable" compared to a prior scan, suggesting an ongoing but not acutely expanding condition at the time of the note.
### Interpretation
This diagram is a visual representation of **clinical diagnostic reasoning**. It demonstrates how a clinician synthesizes disparate pieces of information from a patient's record to arrive at a diagnosis.
* **What the data suggests:** The patient presents with a complex picture involving both risk factors for ischemic stroke (carotid disease, CHF) and definitive evidence of hemorrhagic stroke (thalamic hematoma). The diagram logically concludes that a **stroke is highly suspected**, and further classifies it as having a **hemorrhagic component** based on imaging, while acknowledging an **ischemic risk profile**.
* **How elements relate:** The "Rationale" section acts as the critical bridge, translating raw clinical data (symptoms, history, imaging) into pathophysiological mechanisms. The color-coded arrows create a traceable audit trail from evidence to conclusion.
* **Notable patterns:** The most significant pattern is the **co-occurrence of ischemic risk factors and hemorrhagic evidence**. This is not uncommon in clinical practice, where patients may have multiple comorbidities. The diagram effectively shows that a single diagnosis ("Stroke") can have multiple contributing factors and subtypes. The redaction of specific values (stenosis percentage, hematoma size) highlights that the diagnostic logic often relies on the *presence* and *qualitative description* of findings rather than precise numbers alone.
DECODING INTELLIGENCE...