## Line Graph: Differentiable Parameter Learning with 3 labels
### Overview
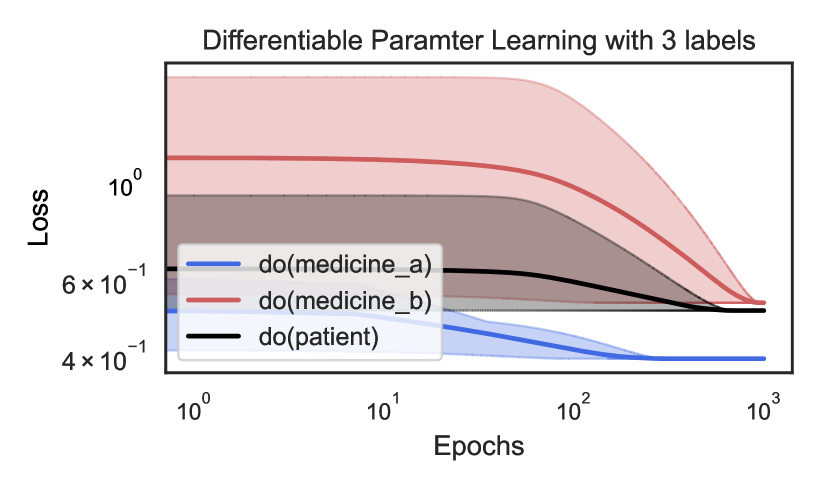
The image is a logarithmic-scale line graph comparing the loss reduction of three interventions ("do(medicine_a)", "do(medicine_b)", and "do(patient)") over training epochs. The y-axis represents loss (log scale: 4×10⁻¹ to 10⁰), and the x-axis represents epochs (log scale: 10⁰ to 10³). Each line includes a shaded confidence interval region.
### Components/Axes
- **Title**: "Differentiable Parameter Learning with 3 labels"
- **X-axis**:
- Label: "Epochs"
- Scale: Logarithmic (10⁰, 10¹, 10², 10³)
- **Y-axis**:
- Label: "Loss"
- Scale: Logarithmic (4×10⁻¹, 6×10⁻¹, 10⁰)
- **Legend**:
- Position: Bottom-left corner
- Entries:
- Blue line: "do(medicine_a)"
- Red line: "do(medicine_b)"
- Black line: "do(patient)"
- **Shaded Regions**: Confidence intervals around each line (darker for lower bounds, lighter for upper bounds).
### Detailed Analysis
1. **do(medicine_a) (Blue Line)**:
- Initial loss: ~1.0 (10⁰) at 10⁰ epochs.
- Final loss: ~6×10⁻¹ at 10³ epochs.
- Trend: Steepest decline, with loss dropping ~40% over 10³ epochs.
- Confidence interval: Widest at early epochs (~0.2 range), narrowing to ~0.1 by 10³ epochs.
2. **do(medicine_b) (Red Line)**:
- Initial loss: ~8×10⁻¹ at 10⁰ epochs.
- Final loss: ~5×10⁻¹ at 10³ epochs.
- Trend: Moderate decline (~37.5% reduction), slower than "do(medicine_a)".
- Confidence interval: Narrower than blue but wider than black, stabilizing at ~0.05 range by 10³ epochs.
3. **do(patient) (Black Line)**:
- Initial loss: ~7×10⁻¹ at 10⁰ epochs.
- Final loss: ~6×10⁻¹ at 10³ epochs.
- Trend: Minimal reduction (~14% decrease), flattest slope.
- Confidence interval: Narrowest throughout, with ~0.02 range at all epochs.
### Key Observations
- All interventions show decreasing loss with increasing epochs, but rates differ significantly.
- "do(medicine_a)" achieves the largest loss reduction but has the highest initial variability.
- "do(patient)" shows the least improvement, suggesting lower efficacy or different optimization dynamics.
- Confidence intervals indicate that "do(medicine_a)"'s estimates are less certain early in training but stabilize over time.
### Interpretation
The graph demonstrates that "do(medicine_a)" is the most effective intervention for reducing loss, with a steep learning curve. Its wide early confidence intervals suggest high variability in initial parameter estimates, which becomes more stable as training progresses. "do(medicine_b)" offers moderate improvements with consistent performance, while "do(patient)" shows minimal impact, possibly indicating suboptimal parameter adjustments or resistance to optimization. The logarithmic scales emphasize exponential decay in loss, highlighting the efficiency of "do(medicine_a)" in large-scale training scenarios. The shaded regions underscore the importance of considering uncertainty in parameter learning, particularly for interventions with high initial variability.