\n
## Diagram: Evolution of Neural Network Architectures & LLM Development
### Overview
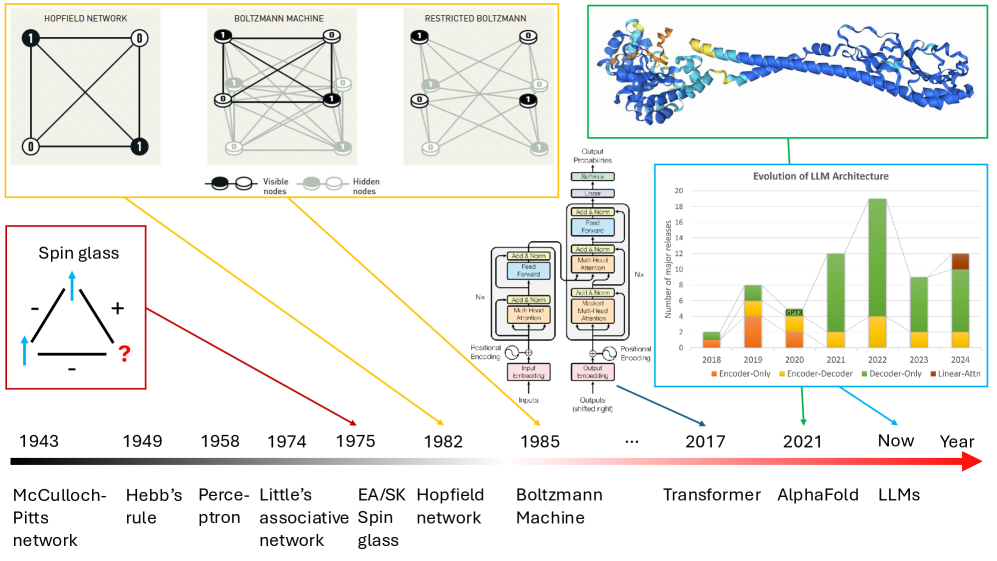
This image presents a historical overview of neural network architectures, starting from the McCulloch-Pitts network in 1943 and culminating in Large Language Models (LLMs) in the present day. It combines diagrams of different network types with a bar chart illustrating the evolution of LLM architectures. The diagram visually connects the development of these architectures over time.
### Components/Axes
The image is divided into three main sections:
1. **Historical Network Diagrams (Top):** Illustrations of Hopfield Network, Boltzmann Machine, Restricted Boltzmann Machine, and Spin Glass.
2. **Network Component Diagram (Center-Right):** A detailed breakdown of the Transformer architecture.
3. **LLM Architecture Evolution Chart (Bottom-Right):** A bar chart showing the number of major releases of different LLM architectures over time (2018-2024).
**Chart Axes:**
* **X-axis:** Year (2018, 2019, 2020, 2021, 2022, 2023, 2024)
* **Y-axis:** Number of major releases (Scale from 0 to 20, increments of 2)
**Chart Legend:**
* Encoder-Only (Green)
* Encoder-Decoder (Orange)
* Decoder-Only (Gray)
* Linear-Attention (Brown)
**Timeline Labels:**
* 1943: McCulloch-Pitts network
* 1949: Hebb's rule
* 1958: Perceptron
* 1974: Little's associative network
* 1975: EA/SK Spin glass
* 1982: Hopfield network
* 1985: Boltzmann Machine
* …: (Ellipsis indicating time passing)
* 2017: Transformer
* 2021: AlphaFold
* Now: LLMs
**Diagram Labels:**
* Visible nodes
* Hidden nodes
* Output Percentiles
* Softmax
* Add & Norm
* Feed Forward
* Add & Norm
* Multi-Head Attention
* Add & Norm
* Positional Encoding
* Input Embedding
* Outputs (shifted right)
* Inputs
### Detailed Analysis or Content Details
**Historical Network Diagrams:**
* **McCulloch-Pitts Network (1943):** A simple diagram showing interconnected nodes.
* **Hebb's Rule (1949):** Depicts a connection with a "+" symbol, representing strengthening of connections. A question mark is also present.
* **Perceptron (1958):** A network with input nodes, a single output node, and connections.
* **Little's Associative Network (1974):** A network with interconnected nodes.
* **EA/SK Spin Glass (1975):** A network with interconnected nodes.
* **Hopfield Network (1982):** A fully connected network of nodes.
* **Boltzmann Machine (1985):** A network with visible and hidden nodes, interconnected.
* **Restricted Boltzmann Machine:** A network with visible and hidden nodes, interconnected. A 3D representation of a protein structure is also shown.
**Transformer Architecture Diagram:**
The diagram shows a detailed breakdown of the Transformer architecture, including components like: Positional Encoding, Input Embedding, Multi-Head Attention, Feed Forward, Add & Norm, and Softmax. The flow of information is generally from left to right.
**LLM Architecture Evolution Chart:**
* **2018:** Approximately 2 Encoder-Only releases, 1 Encoder-Decoder release, and 0 Decoder-Only releases.
* **2019:** Approximately 4 Encoder-Only releases, 2 Encoder-Decoder releases, and 0 Decoder-Only releases.
* **2020:** Approximately 6 Encoder-Only releases, 4 Encoder-Decoder releases, and 2 Decoder-Only releases.
* **2021:** Approximately 8 Encoder-Only releases, 6 Encoder-Decoder releases, and 4 Decoder-Only releases.
* **2022:** Approximately 10 Encoder-Only releases, 8 Encoder-Decoder releases, and 6 Decoder-Only releases.
* **2023:** Approximately 12 Encoder-Only releases, 10 Encoder-Decoder releases, and 8 Decoder-Only releases.
* **2024:** Approximately 14 Encoder-Only releases, 12 Encoder-Decoder releases, and 10 Decoder-Only releases. There is also approximately 2 Linear-Attention releases.
The trend shows a consistent increase in the number of releases for all architecture types over time. Decoder-Only architectures have seen the most significant growth in recent years.
### Key Observations
* The number of major releases of LLM architectures has increased exponentially from 2018 to 2024.
* Encoder-Only architectures have consistently been the most prevalent type of LLM architecture.
* Decoder-Only architectures have experienced the most rapid growth in recent years.
* The historical network diagrams demonstrate a progression from simpler models to more complex ones.
* The Transformer architecture is a key component in the development of modern LLMs.
### Interpretation
The image illustrates the rapid evolution of neural network architectures, culminating in the current dominance of LLMs. The historical diagrams show a clear progression from early models like the McCulloch-Pitts network and the Perceptron to more sophisticated architectures like the Boltzmann Machine and the Transformer. The bar chart highlights the recent explosion in LLM development, with a significant increase in the number of releases across all architecture types. The increasing prevalence of Decoder-Only architectures suggests a shift towards generative models. The diagram effectively demonstrates the interconnectedness of these developments, showing how each advancement builds upon previous work. The inclusion of AlphaFold indicates the application of these architectures to other domains beyond natural language processing. The overall message is one of accelerating innovation in the field of artificial intelligence.