\n
## Line Chart: Complexity vs. Surplus over Time
### Overview
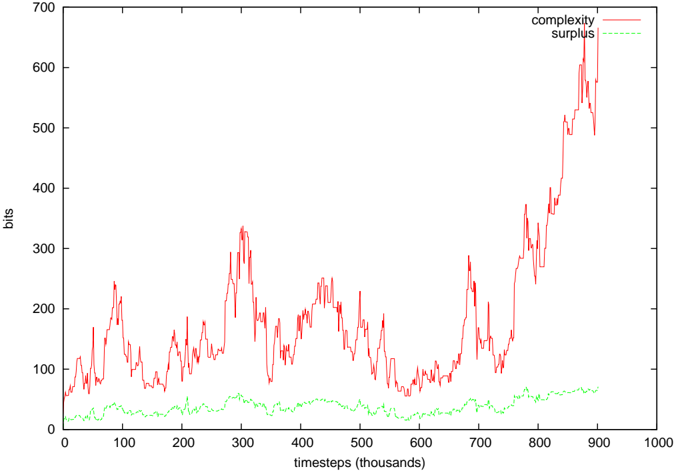
The image presents a line chart illustrating the relationship between "complexity" and "surplus" over time, measured in "timesteps (thousands)". The y-axis represents values in "bits". The chart displays fluctuating complexity with a generally increasing trend, while surplus remains relatively stable and low.
### Components/Axes
* **X-axis:** "timesteps (thousands)", ranging from 0 to 1000. The axis is marked with tick intervals of 100.
* **Y-axis:** "bits", ranging from 0 to 700. The axis is marked with tick intervals of 100.
* **Data Series 1:** "complexity" - represented by a red line.
* **Data Series 2:** "surplus" - represented by a green line.
* **Legend:** Located in the top-right corner, labeling the two data series with their corresponding colors.
### Detailed Analysis
**Complexity (Red Line):**
The red line representing complexity exhibits significant fluctuations throughout the observed time period. The line generally slopes upward, indicating an overall increase in complexity.
* At timestep 0, complexity is approximately 20 bits.
* Around timestep 100, complexity reaches a local maximum of approximately 120 bits.
* Around timestep 200, complexity reaches a local maximum of approximately 310 bits.
* Around timestep 300, complexity drops to approximately 150 bits.
* Around timestep 400, complexity reaches approximately 230 bits.
* Around timestep 500, complexity drops to approximately 80 bits.
* Around timestep 600, complexity reaches approximately 240 bits.
* Around timestep 700, complexity reaches approximately 300 bits.
* Around timestep 800, complexity rapidly increases, peaking at approximately 630 bits.
* At timestep 900, complexity is approximately 550 bits.
* At timestep 1000, complexity is approximately 520 bits.
**Surplus (Green Line):**
The green line representing surplus remains relatively stable and low throughout the observed time period.
* At timestep 0, surplus is approximately 20 bits.
* Around timestep 100, surplus is approximately 30 bits.
* Around timestep 200, surplus is approximately 40 bits.
* Around timestep 300, surplus is approximately 30 bits.
* Around timestep 400, surplus is approximately 40 bits.
* Around timestep 500, surplus is approximately 30 bits.
* Around timestep 600, surplus is approximately 40 bits.
* Around timestep 700, surplus is approximately 30 bits.
* Around timestep 800, surplus is approximately 40 bits.
* At timestep 900, surplus is approximately 30 bits.
* At timestep 1000, surplus is approximately 30 bits.
### Key Observations
* Complexity exhibits much greater variability than surplus.
* The overall trend for complexity is upward, while surplus remains relatively constant.
* There is a significant spike in complexity around timestep 800, with a value exceeding 600 bits, while surplus remains stable.
* Surplus consistently remains below 50 bits throughout the entire observation period.
### Interpretation
The data suggests a system where complexity increases over time, but this increase is not necessarily accompanied by a corresponding increase in surplus. The consistent low level of surplus, despite the increasing complexity, could indicate diminishing returns or inefficiencies in the system. The sharp increase in complexity around timestep 800 is a notable outlier, potentially representing a critical transition or event within the system. This event does not appear to generate a corresponding increase in surplus, suggesting that the added complexity may not be directly contributing to increased output or value. The relationship between complexity and surplus could be further investigated to understand the underlying dynamics of the system and identify potential areas for optimization. The chart demonstrates a clear divergence between the two metrics, indicating that simply increasing complexity does not guarantee an increase in surplus.