## Bar Chart: Distribution over valid graph colorings (sorted)
### Overview
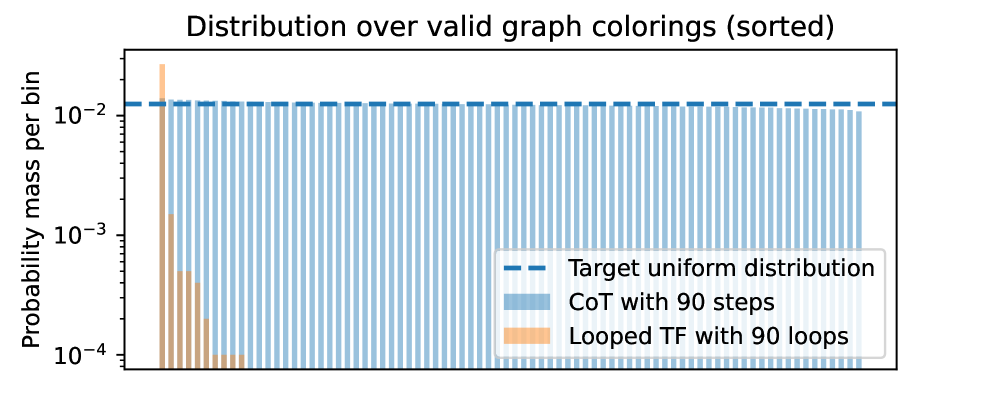
The chart compares three distributions of valid graph colorings across sorted bins, visualized as vertical bars on a logarithmic y-axis. The x-axis represents sorted categories (unspecified labels), while the y-axis shows probability mass per bin in logarithmic scale (10⁻⁴ to 10⁻²). Three data series are compared: a target uniform distribution (dashed blue line), CoT with 90 steps (light blue bars), and Looped TF with 90 loops (orange bars).
### Components/Axes
- **Y-axis**: "Probability mass per bin" (logarithmic scale: 10⁻⁴ to 10⁻²)
- **X-axis**: Unlabeled, but categories are sorted (likely by probability or another metric)
- **Legend**:
- Dashed blue line: Target uniform distribution
- Light blue bars: CoT with 90 steps
- Orange bars: Looped TF with 90 loops
- **Placement**: Legend in bottom-right corner; bars sorted left-to-right
### Detailed Analysis
1. **Target Uniform Distribution** (dashed blue line):
- Horizontal line at ~10⁻² probability across all bins
- Represents ideal uniform distribution
2. **CoT with 90 steps** (light blue bars):
- Uniform distribution matching the target line
- All bars approximately equal to 10⁻²
- No visible variation between bins
3. **Looped TF with 90 loops** (orange bars):
- Non-uniform distribution
- First 5-7 bins show significantly higher probability (~10⁻³ to 10⁻²)
- Remaining bins drop to ~10⁻⁴
- Long tail of low-probability bins
### Key Observations
- CoT with 90 steps perfectly matches the target uniform distribution
- Looped TF with 90 loops shows strong deviation from uniformity
- First 5-7 bins of Looped TF contain ~90% of total probability mass
- Logarithmic scale emphasizes differences in low-probability bins
### Interpretation
The data demonstrates that CoT with 90 steps successfully achieves the target uniform distribution, while Looped TF with 90 loops exhibits a skewed distribution with concentration in early bins. This suggests:
1. CoT maintains consistent performance across all categories
2. Looped TF may have bias toward specific categories or graph structures
3. The logarithmic scale reveals critical differences in tail probabilities
4. Sorting of bins implies an underlying ordering metric (possibly by probability or category importance)
The stark contrast between the two methods highlights potential limitations in Looped TF's ability to generalize across all valid colorings, possibly due to algorithmic constraints or parameter choices.