## Line Chart: Pass Rate vs. Number of Patches
### Overview
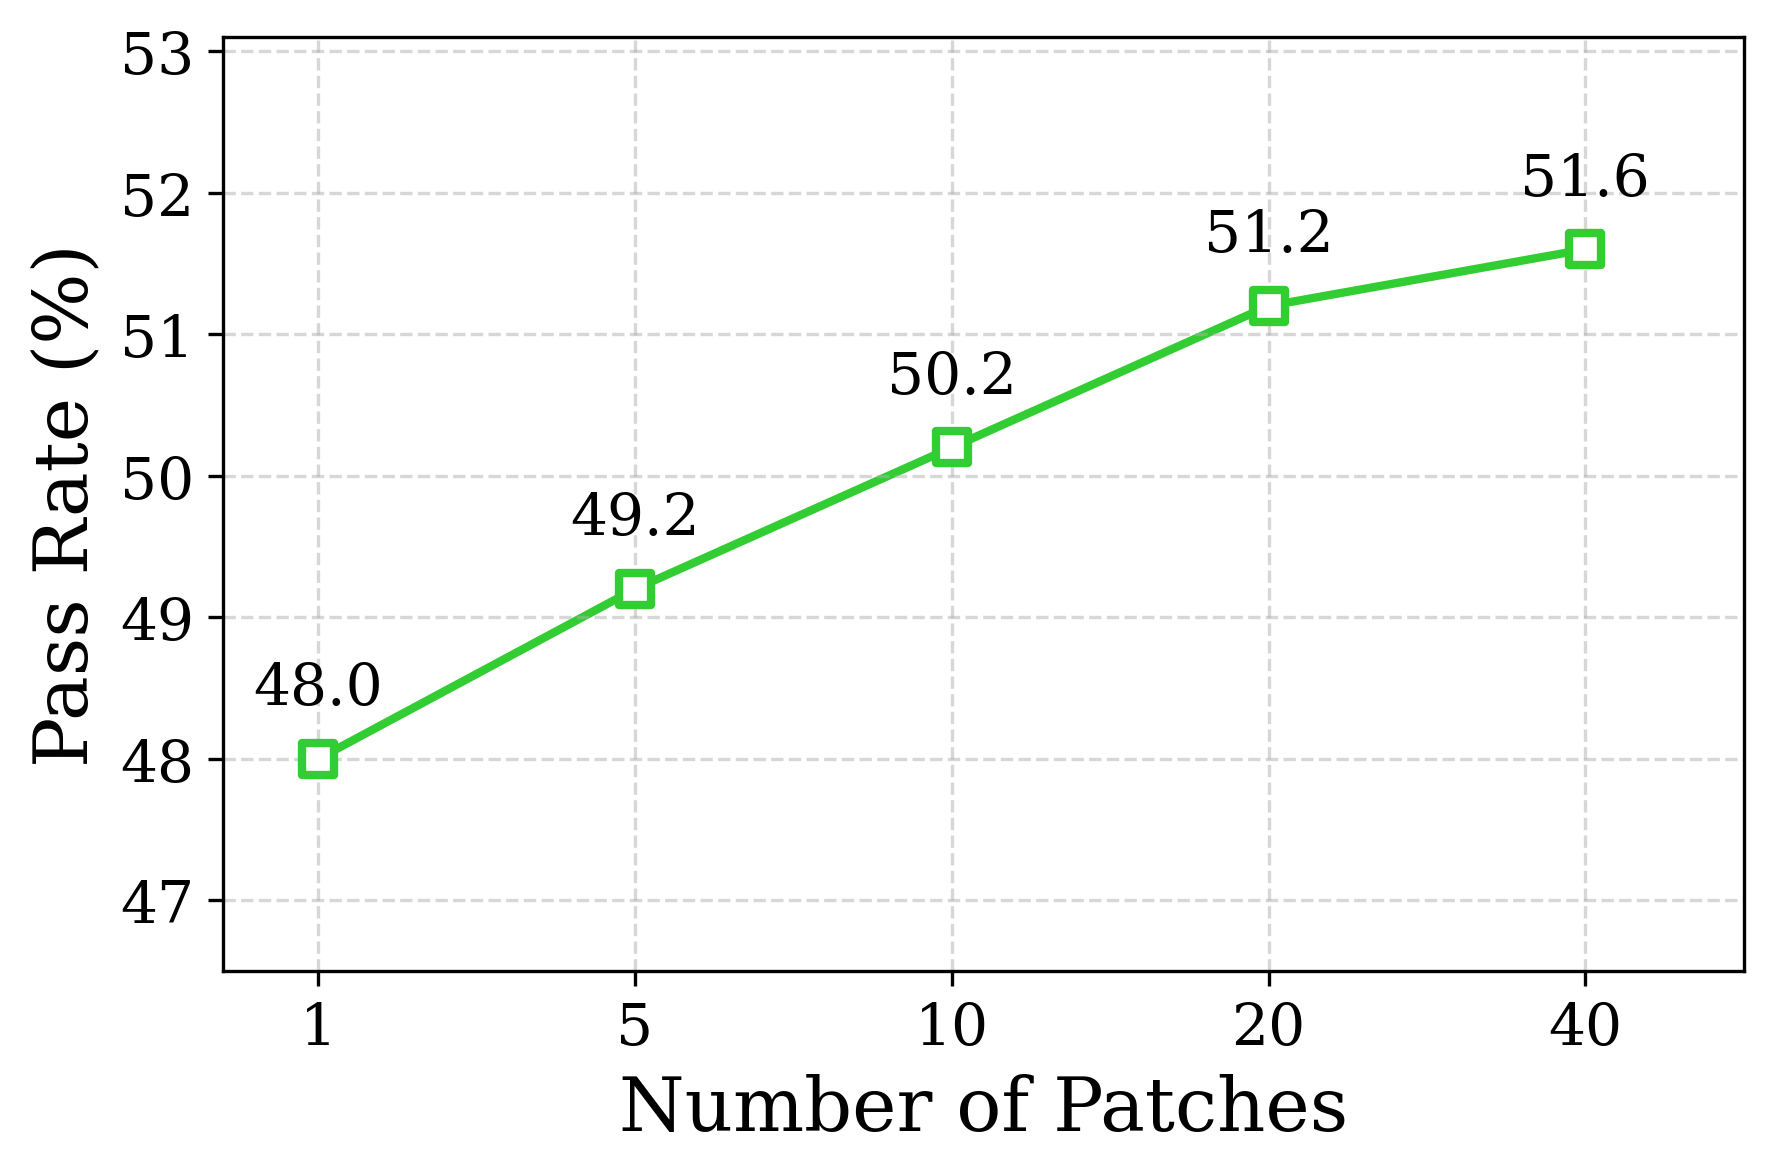
This image is a two-dimensional line chart that illustrates the relationship between the "Number of Patches" applied or utilized and the resulting "Pass Rate (%)". The chart features a single data series plotted on a dashed grid, showing a clear positive correlation between the two variables. All text in the image is in English.
### Components/Axes
* **Y-Axis (Vertical, Left side):**
* **Label:** "Pass Rate (%)" (Oriented vertically, reading bottom-to-top).
* **Scale:** Linear.
* **Markers:** 47, 48, 49, 50, 51, 52, 53.
* **Gridlines:** Horizontal light gray dashed lines extend from each marker across the chart area.
* **X-Axis (Horizontal, Bottom edge):**
* **Label:** "Number of Patches" (Centered below the axis markers).
* **Scale:** Non-linear / Categorical. The physical distance between each marker on the graph is identical, despite the numerical intervals being unequal (intervals of 4, 5, 10, and 20).
* **Markers:** 1, 5, 10, 20, 40.
* **Gridlines:** Vertical light gray dashed lines extend upward from each marker.
* **Data Series:**
* A single solid, bright green line.
* **Data Points:** Marked by hollow green squares with a white center.
* **Data Labels:** Exact numerical values printed in black text directly above each green square marker.
### Detailed Analysis
**Trend Verification:**
The green line begins at the bottom-left of the chart area and slopes consistently upward toward the top-right. The slope is relatively steep and consistent between the first four data points, but the angle of the slope visibly decreases (flattens out) between the fourth and fifth data points.
**Data Point Extraction:**
Based on the explicit data labels positioned above the green square markers, the exact values are as follows:
* At **1** (Number of Patches), the Pass Rate is **48.0%**.
* At **5** (Number of Patches), the Pass Rate is **49.2%**.
* At **10** (Number of Patches), the Pass Rate is **50.2%**.
* At **20** (Number of Patches), the Pass Rate is **51.2%**.
* At **40** (Number of Patches), the Pass Rate is **51.6%**.
### Key Observations
* **Positive Correlation:** There is a direct, positive relationship between the number of patches and the pass rate. Increasing the number of patches always results in a higher pass rate within the scope of this chart.
* **Diminishing Returns:** While the pass rate increases, the *rate of increase* slows down significantly at higher numbers of patches.
* Adding 9 patches (from 1 to 10) yields a **2.2%** increase in pass rate.
* Adding 10 patches (from 10 to 20) yields a **1.0%** increase.
* Adding 20 patches (from 20 to 40) yields only a **0.4%** increase.
* **Visual Distortion:** Because the X-axis uses equal physical spacing for unequal numerical intervals (1 to 5 is the same visual width as 20 to 40), the visual slope of the line makes the performance gains look more linear than they actually are. If the X-axis were plotted on a true linear scale, the line would curve sharply and flatten out much more dramatically to the right.
### Interpretation
This chart demonstrates the efficacy of increasing "patches" to improve a system's "pass rate." In technical contexts, "patches" likely refers to either software updates/fixes, or, more likely in the context of machine learning/computer vision, image segments (e.g., Vision Transformer patches) used for processing. The "pass rate" likely refers to an accuracy benchmark, successful compilation rate, or validation metric.
The data clearly suggests that while increasing the number of patches improves performance, the system experiences severe diminishing returns. The computational cost or resource allocation required to jump from 20 to 40 patches (doubling the input) only yields a marginal 0.4% improvement.
From an investigative standpoint, the creator of this chart chose a non-linear X-axis to present the data. This design choice visually softens the impact of the diminishing returns, making the progression look like a steady climb rather than a plateau. An engineer reading this chart would likely conclude that the optimal trade-off between resource cost (number of patches) and performance (pass rate) lies somewhere between 10 and 20 patches, as pushing to 40 yields negligible benefits. Furthermore, the absolute maximum pass rate shown is 51.6%, indicating that even with maximum patches applied, the system only slightly exceeds a 50% success rate.