## Pie Chart: Distribution of Categories
### Overview
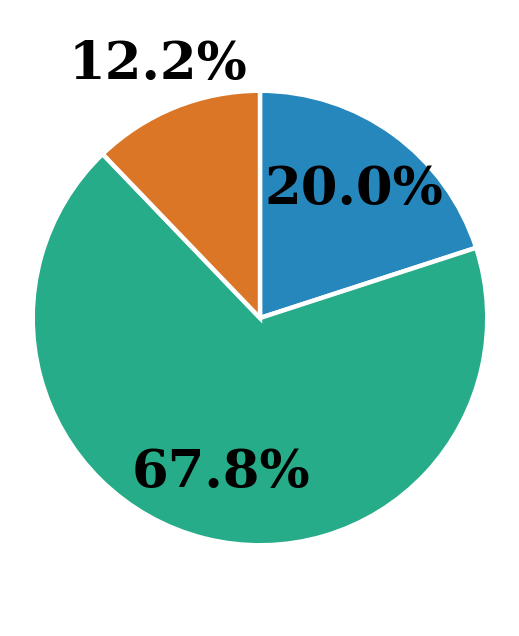
The image displays a pie chart divided into three distinct sections, each labeled with a percentage. The largest section is teal (67.8%), followed by a medium-sized blue section (20.0%), and the smallest orange section (12.2%). The legend is positioned at the top of the chart, with each color explicitly labeled with its corresponding percentage.
### Components/Axes
- **Legend**: Located at the top-center of the chart, the legend uses three colors:
- **Teal**: 67.8%
- **Blue**: 20.0%
- **Orange**: 12.2%
- **Chart Sections**: Each section is separated by thin white borders, with the percentages labeled in black text inside their respective segments.
### Detailed Analysis
1. **Teal Section (67.8%)**:
- Occupies the majority of the pie chart, spanning approximately two-thirds of the circle.
- Positioned as the dominant category, it is visually the largest segment.
2. **Blue Section (20.0%)**:
- Occupies roughly one-fifth of the chart, placed adjacent to the teal section.
- Smaller than the teal section but larger than the orange section.
3. **Orange Section (12.2%)**:
- The smallest segment, occupying the remaining portion of the chart.
- Positioned opposite the teal section, creating a balanced visual distribution.
### Key Observations
- The teal section (67.8%) is significantly larger than the other two categories combined (32.2%).
- The blue and orange sections are roughly in a 1.6:1 ratio (20.0% vs. 12.2%).
- All percentages sum to 100%, confirming the chart represents a complete distribution.
### Interpretation
The data suggests a highly skewed distribution, with one category (teal) dominating the dataset. This could indicate a scenario where a single factor or group accounts for the majority of the total, while the remaining categories represent smaller but notable contributions. The blue section (20.0%) acts as a secondary contributor, while the orange section (12.2%) represents the least significant portion. Such a distribution might highlight imbalances or concentrations in the underlying data, warranting further investigation into the causes of the disparity.