## Grouped Bar Chart: Distribution of Text and Image Token Usage Across Experts in Different Layers
### Overview
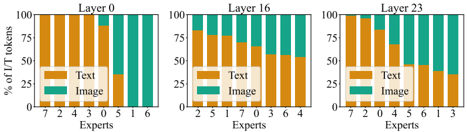
The image displays three grouped bar charts representing the distribution of text (orange) and image (teal) token usage across experts in three transformer layers (Layer 0, Layer 16, Layer 23). Each chart shows the percentage of text/image tokens processed by individual experts within their respective layers.
### Components/Axes
- **X-axis**: Labeled "Experts," listing expert IDs (0–7). Layer 0 includes experts 0–6 (7 experts), while Layers 16 and 23 include experts 0–7 (8 experts).
- **Y-axis**: Labeled "% of L/T tokens," scaled from 0% to 100% in 25% increments.
- **Legends**: Positioned at the bottom-left of each chart. Orange represents "Text," teal represents "Image."
- **Charts**: Three separate bar charts, one per layer, arranged horizontally.
### Detailed Analysis
#### Layer 0
- **Experts 0–6**:
- Text tokens dominate, with most bars exceeding 75% (e.g., Expert 0: ~80%, Expert 6: ~95%).
- Image tokens are minimal, with only Expert 5 showing ~20% image usage.
- **Trend**: Nearly uniform text dominance across all experts.
#### Layer 16
- **Experts 0–7**:
- Mixed distribution: Text ranges from ~40% (Expert 6) to ~80% (Expert 0).
- Image tokens increase in mid-to-high experts (e.g., Expert 5: ~40%, Expert 7: ~60%).
- **Trend**: Gradual shift toward image token usage in higher-numbered experts.
#### Layer 23
- **Experts 0–7**:
- Text tokens decline significantly (e.g., Expert 0: ~70%, Expert 7: ~50%).
- Image tokens dominate, with Experts 1, 3, and 6 showing ~70–90% image usage.
- Outlier: Expert 4 has ~30% image usage, the lowest in the layer.
- **Trend**: Strong shift toward image token processing, with experts 1, 3, and 6 specializing in image handling.
### Key Observations
1. **Layer 0**: Text tokens overwhelmingly dominate (80–95% range), with minimal image processing.
2. **Layer 16**: Balanced but uneven distribution, with mid-experts (5–7) handling more image tokens.
3. **Layer 23**: Image tokens dominate (50–90% range), with experts 1, 3, and 6 as primary image processors.
4. **Expert Specialization**: Experts 1, 3, and 6 in Layer 23 exhibit unique roles in image token processing.
### Interpretation
The data suggests a hierarchical processing strategy:
- **Early Layers (Layer 0)**: Focus on text token extraction, likely for foundational language understanding.
- **Mid Layers (Layer 16)**: Begin integrating multimodal data, with some experts specializing in image-text alignment.
- **Late Layers (Layer 23)**: Prioritize image token processing, indicating a shift toward visual-semantic synthesis. Experts 1, 3, and 6 in Layer 23 may act as specialized "image gatekeepers," filtering or refining visual information for higher-level tasks.
Notable anomalies include Expert 4 in Layer 23 (low image usage) and Expert 5 in Layer 16 (highest image usage in that layer), suggesting potential architectural or functional diversity among experts. The increasing image token reliance in deeper layers aligns with transformer architectures' tendency to handle multimodal integration in later stages.