## Line Graph: Accuracy vs. Sample Size
### Overview
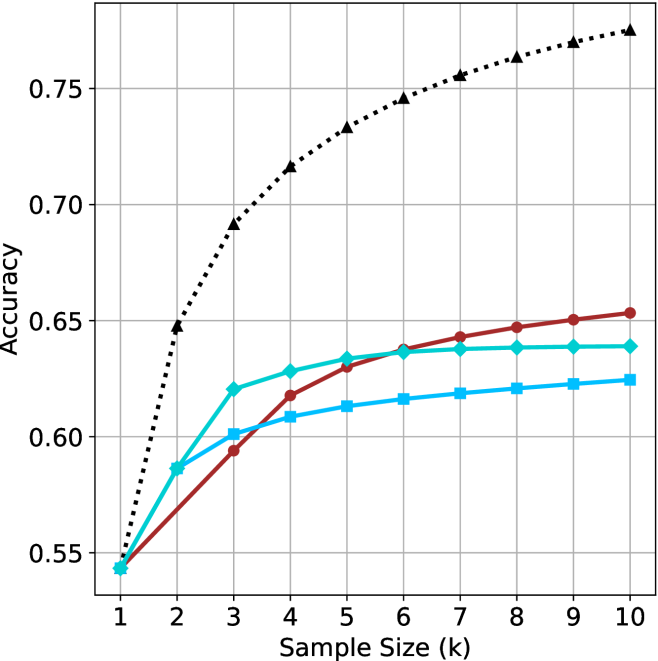
The graph illustrates the relationship between sample size (k) and accuracy for three distinct methods. The black dotted line (Method A) demonstrates the highest accuracy, followed by the red solid line (Method B) and the blue solid line (Method C). All methods show increasing accuracy with larger sample sizes, but Method A achieves significantly higher performance, particularly beyond k=3.
### Components/Axes
- **X-axis**: Sample Size (k), labeled with integer values from 1 to 10.
- **Y-axis**: Accuracy, scaled from 0.55 to 0.75 in increments of 0.05.
- **Legend**: Located in the top-right corner, with three entries:
- Black dotted line: Method A
- Red solid line: Method B
- Blue solid line: Method C
### Detailed Analysis
1. **Method A (Black Dotted Line)**:
- Starts at (1, 0.55) and sharply increases to (2, 0.65).
- Continues rising to (3, 0.70), (4, 0.72), (5, 0.73), (6, 0.74), (7, 0.75), (8, 0.76), (9, 0.77), and (10, 0.78).
- **Trend**: Rapid initial growth, followed by a plateau near 0.78 for k ≥ 7.
2. **Method B (Red Solid Line)**:
- Begins at (1, 0.55) and gradually increases to (2, 0.58), (3, 0.60), (4, 0.62), (5, 0.63), (6, 0.64), (7, 0.64), (8, 0.64), (9, 0.64), and (10, 0.64).
- **Trend**: Steady but slower improvement, plateauing at ~0.64 for k ≥ 6.
3. **Method C (Blue Solid Line)**:
- Starts at (1, 0.55) and rises to (2, 0.59), (3, 0.61), (4, 0.63), (5, 0.64), (6, 0.64), (7, 0.64), (8, 0.64), (9, 0.64), and (10, 0.64).
- **Trend**: Similar to Method B but slightly lower accuracy, plateauing at ~0.64 for k ≥ 5.
### Key Observations
- **Method A** consistently outperforms the other methods, achieving ~0.78 accuracy at k=10 compared to ~0.64 for Methods B and C.
- All methods exhibit diminishing returns after k=5–7, with accuracy plateaus indicating limited gains from further sample size increases.
- The black dotted line (Method A) shows the steepest slope, suggesting higher sensitivity to sample size changes.
### Interpretation
The data highlights **Method A** as the most effective approach, with accuracy surpassing 0.75 for k ≥ 7. Methods B and C, while less performant, still demonstrate incremental improvements with larger samples. The plateaus suggest that beyond a critical sample size (k=5–7), additional data collection yields minimal accuracy gains. This could imply that Method A is optimized for scalability, whereas Methods B and C may face inherent limitations (e.g., algorithmic constraints or data noise). The sharp rise in Method A’s accuracy at k=2–3 indicates a potential threshold effect, where small sample size increases disproportionately improve performance.