\n
## Diagram: 10x10 Colored Grid Matrix
### Overview
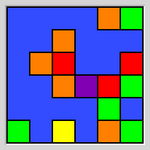
The image displays a 10x10 grid composed of square cells. The background of the entire grid is a uniform medium blue. Within this grid, 24 cells are filled with distinct, solid colors, while the remaining 76 cells retain the blue background color. There are no titles, axis labels, numerical markers, or legends present in the image. The diagram appears to be a visual mapping or classification grid where position and color are the primary data carriers.
### Components/Axes
* **Grid Structure:** A perfect 10x10 matrix. Rows can be numbered 1-10 from top to bottom, and columns 1-10 from left to right for spatial reference.
* **Color Palette:** Six distinct colors are used for the filled cells:
* Orange
* Red
* Green (a bright, slightly yellow-green)
* Yellow
* Purple
* A darker shade of Blue (used for one cell, distinct from the background)
* **Legend:** No legend is provided. The meaning of each color is undefined.
* **Labels/Axes:** No text labels, row/column identifiers, or axis titles are present.
### Detailed Analysis
**Spatial Distribution of Colored Cells:**
The colored cells are not randomly scattered but form distinct clusters and isolated points.
* **Top-Right Quadrant (Rows 1-5, Columns 6-10):** This is the most densely populated area.
* A cluster of **Orange** cells is centered around (Row 2, Column 7) and (Row 3, Column 6).
* **Green** cells appear at (Row 1, Column 9), (Row 4, Column 9), and (Row 5, Column 10).
* **Red** cells are located at (Row 4, Column 10) and (Row 5, Column 9).
* **Center:** A single **Purple** cell is positioned at the exact center of the grid (Row 6, Column 6). It is surrounded by blue background cells on all eight sides.
* **Bottom-Left Quadrant (Rows 6-10, Columns 1-5):**
* A cluster of **Green** cells is at the bottom-left corner: (Row 9, Column 1) and (Row 10, Column 1).
* A **Yellow** cell is at (Row 10, Column 4).
* An **Orange** cell is at (Row 10, Column 8), which is in the bottom-right quadrant.
* **Other Notable Cells:**
* A **Darker Blue** cell (different from the background) is at (Row 6, Column 8).
* Isolated **Orange** cells appear at (Row 4, Column 3) and (Row 5, Column 4).
* An isolated **Red** cell is at (Row 6, Column 9).
**Trend Verification:**
As this is a static grid and not a time-series chart, trends are interpreted as spatial patterns.
* **Pattern 1 (Clustering):** Colors are not evenly distributed. Orange, Green, and Red show clear clustering in the top-right.
* **Pattern 2 (Isolation):** The Purple and Dark Blue cells are singular and isolated, potentially marking points of unique significance.
* **Pattern 3 (Perimeter Activity):** Several colored cells (Green, Yellow, Orange) are located along the bottom edge of the grid.
### Key Observations
1. **Central Anomaly:** The single Purple cell at (6,6) is the most visually isolated element, drawing attention as a potential focal point or unique category.
2. **Color Dominance:** Orange appears most frequently (5 instances), followed by Green (5 instances), then Red (3 instances). Yellow, Purple, and Dark Blue are singular.
3. **Absence of Data:** The vast majority of the grid (76%) is the uniform blue background, indicating either "empty," "default," or "unclassified" status for those positions.
4. **Lack of Context:** The complete absence of textual labels, a legend, or a title makes definitive interpretation impossible. The data is purely relational (position vs. color).
### Interpretation
This diagram presents a **spatial classification matrix**. Its meaning is entirely dependent on external context not provided in the image.
* **What it could represent:** It might be a heat map for a 10x10 game board (like a minesweeper variant), a status grid for a 10x10 array of sensors or system components, a visual hash or encoding, or a simplified representation of a larger dataset where position (x,y) maps to a category (color).
* **Relationships:** The clustering suggests that certain categories (Orange, Green, Red) are related or co-occur in specific regions of the mapped space. The isolated Purple and Dark Blue cells suggest unique, singular states or markers.
* **Notable Anomalies:** The central Purple cell is the primary anomaly due to its isolation and central positioning. The use of a darker blue cell on a blue background is a subtle but potentially significant distinction, possibly indicating a "special" or "active" state within the default field.
* **Peircean Investigation:** From a semiotic perspective, the image is an **icon** (it resembles a grid) and an **index** (the colors point to some underlying condition or category). Without the **symbolic** key (a legend), the viewer can only analyze the syntactic relationships between positions and colors, not their semantic meaning. The diagram's power and frustration lie in its clear presentation of a pattern whose significance is locked away without the corresponding codebook.