\n
## Diagram: Celestial Observations - Sun's Declination and Azimuth
### Overview
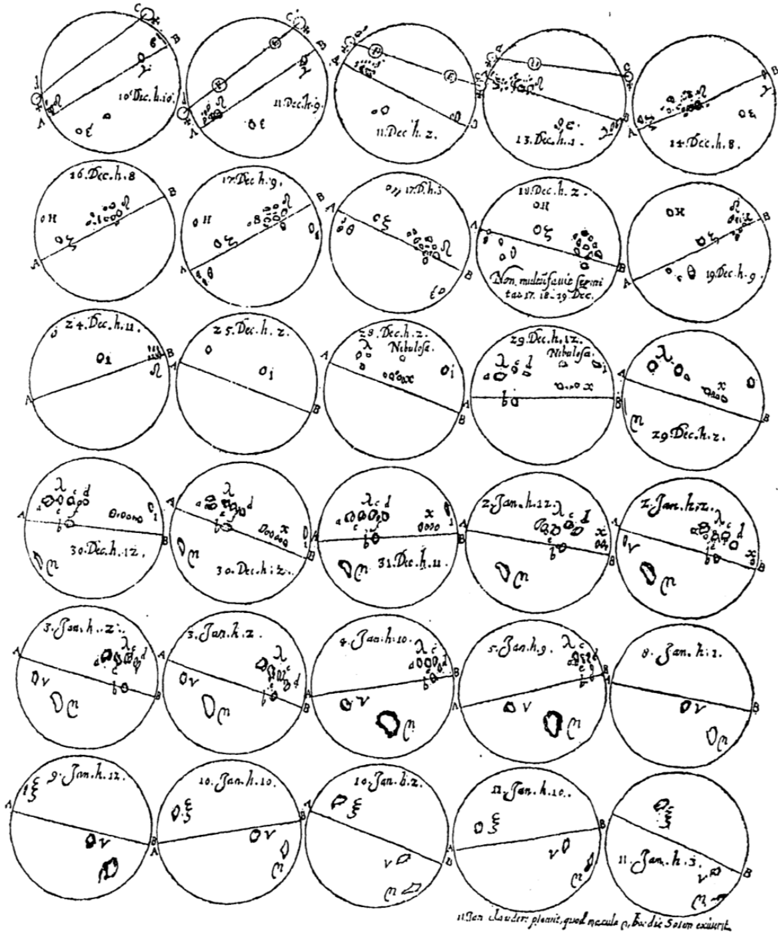
The image presents a series of 24 circular diagrams, arranged in a 4x6 grid. Each diagram appears to represent a specific date and time, documenting astronomical observations, likely related to the sun's position. The diagrams contain hand-drawn lines, symbols, and text, indicating declination, azimuth, and potentially other astronomical parameters. The overall impression is of a historical astronomical record, possibly related to solar observations over a year.
### Components/Axes
Each circular diagram contains the following elements:
* **Date:** A date is inscribed on each circle, formatted as "Day. Month.h.x", where "Day" is a number (1-31), "Month" is a shortened month name (Dec, Jan), "h" is a number (1-12), and "x" is a letter (z, h, s).
* **Circles:** Each diagram is a circle, with a central point.
* **Lines:** Lines are drawn within each circle, radiating from the center. These lines likely represent the sun's azimuth and declination.
* **Symbols:** Various symbols are present within the circles, including crosses, dots, and lettered markings (e.g., "a", "b", "0", "1", "2").
* **Text:** Additional text is present within some circles, including abbreviations and numbers.
* **Footer Text:** A line of text at the bottom of the image reads: "uher claudere placet quod macula a die Sole existent." (Latin).
### Detailed Analysis / Content Details
The diagrams are arranged in rows and columns. Here's a breakdown of the dates and some observed details from each circle, noting the uncertainty due to handwriting and image quality:
**Row 1:**
1. 10.Dec.h.i: Lines and symbols present.
2. 11.Dec.h.g: Lines and symbols present.
3. 11.Dec.h.z: Lines and symbols present.
4. 13.Dec.h.i: Lines and symbols present.
5. 14.Dec.h.s: Lines and symbols present.
6. 19.Dec.h.g: Lines and symbols present.
**Row 2:**
7. 24.Dec.h.u: Lines and symbols present.
8. 25.Dec.h.z: Lines and symbols present.
9. 29.Dec.h.z: Lines and symbols present. Text: "Non mutatur facie formi" and "castr. it. 19.Dec".
10. 29.Dec.h.k: Lines and symbols present.
11. 29.Dec.h.z: Lines and symbols present.
12. 30.Dec.h.k: Lines and symbols present.
**Row 3:**
13. 30.Dec.h.iz: Lines and symbols present.
14. 30.Dec.h.z: Lines and symbols present.
15. 31.Dec.h.k: Lines and symbols present.
16. 2.Jan.h.iz: Lines and symbols present.
17. 3.Jan.h.iz: Lines and symbols present.
18. 4.Jan.h.g: Lines and symbols present.
**Row 4:**
19. 5.Jan.h.i: Lines and symbols present.
20. 6.Jan.h.z: Lines and symbols present.
21. 7.Jan.h.s: Lines and symbols present.
22. 8.Jan.h.i: Lines and symbols present.
23. 9.Jan.h.i: Lines and symbols present.
24. 10.Jan.h.s: Lines and symbols present.
**Footer Text Translation:**
The Latin text "uher claudere placet quod macula a die Sole existent" translates to: "It pleases me to close [this] because a spot exists from the sun by day."
### Key Observations
* The diagrams are consistently formatted, suggesting a systematic approach to observation.
* The dates progress sequentially, starting in December and continuing into January, indicating a record spanning the winter solstice.
* The symbols and lines within each circle vary, likely representing changes in the sun's position over time.
* The presence of the Latin text suggests the observations were made by someone familiar with classical scholarship.
* The reference to a "spot" in the footer text hints at possible sunspot observations.
### Interpretation
This diagram represents a historical record of solar observations, likely made by an astronomer or scholar interested in tracking the sun's movement. The consistent format and sequential dates suggest a deliberate attempt to document changes in the sun's declination and azimuth over a period of time. The inclusion of symbols and annotations indicates a level of detail and analysis beyond simple recording of position. The Latin text adds a layer of historical context, suggesting the observer was part of a scholarly tradition. The mention of a "spot" could indicate early observations of sunspots, which were a subject of scientific interest in the 16th and 17th centuries.
The diagrams likely represent a visual method for recording and analyzing astronomical data before the widespread use of precise instruments and mathematical calculations. The hand-drawn nature of the diagrams suggests a reliance on visual observation and subjective interpretation. The overall impression is of a valuable historical document that provides insight into the methods and practices of early astronomy. The arrangement of the circles in a grid format suggests an attempt to organize and compare observations over time, potentially to identify patterns or trends.