## Scatter Plot: Reasoning Tokens vs. Problem Size by Difficulty
### Overview
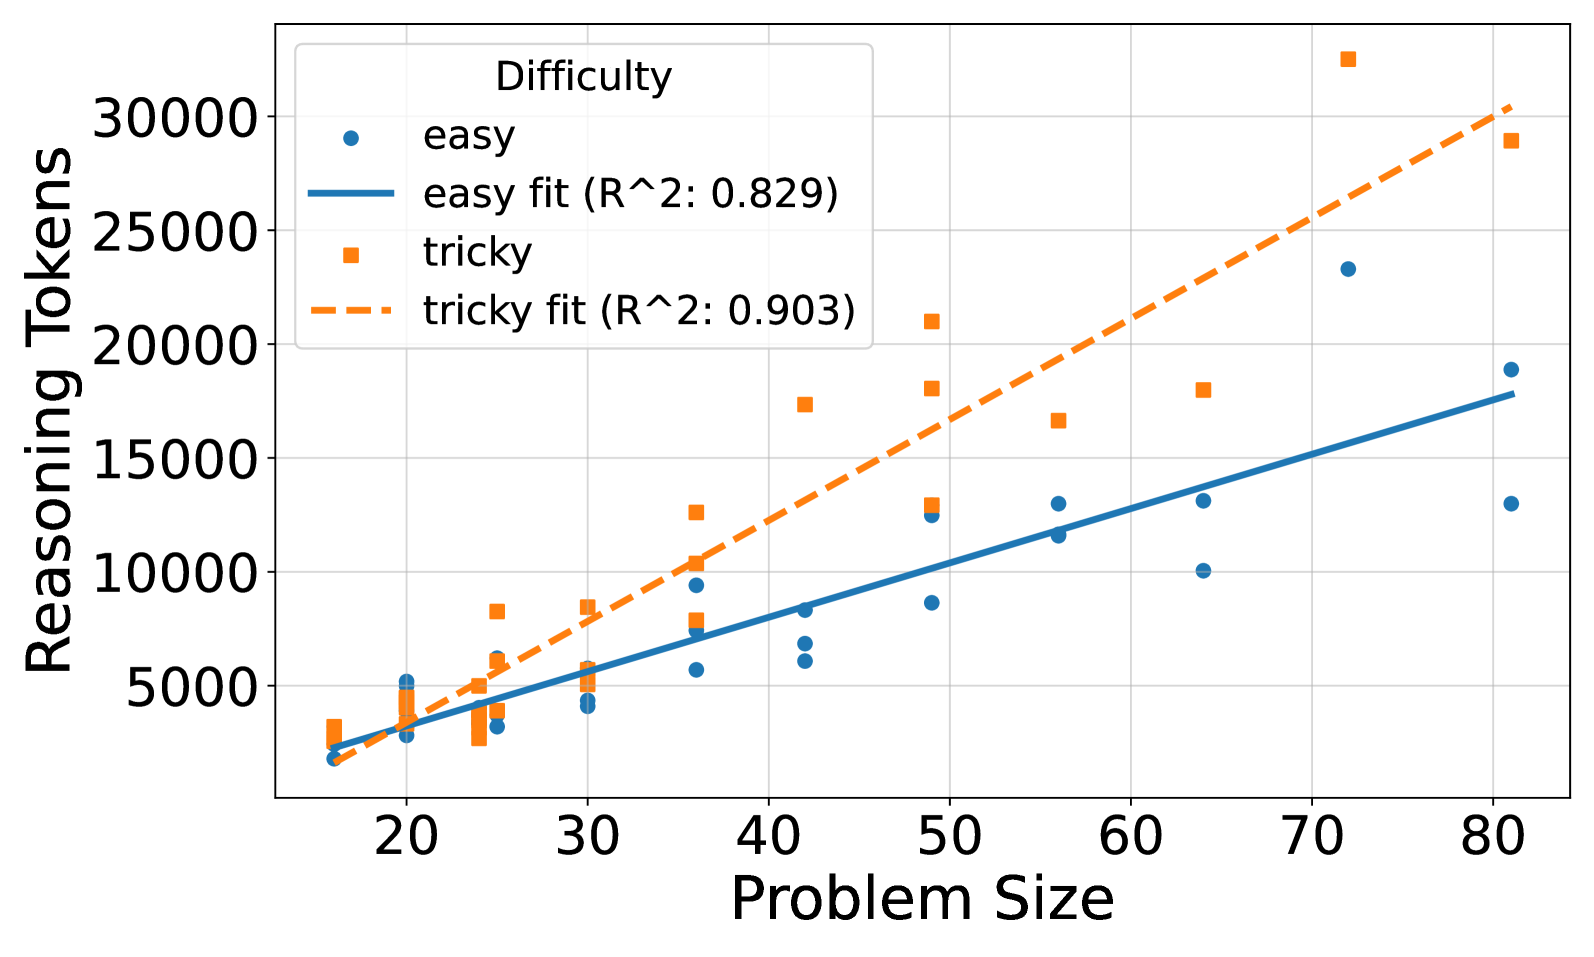
The image is a scatter plot showing the relationship between "Problem Size" and "Reasoning Tokens" for two difficulty levels: "easy" and "tricky". The plot includes trend lines (linear fits) for each difficulty level, along with their respective R-squared values.
### Components/Axes
* **X-axis:** "Problem Size", ranging from approximately 15 to 80 in increments of 10.
* **Y-axis:** "Reasoning Tokens", ranging from 0 to 30000 in increments of 5000.
* **Legend (top-left):**
* "Difficulty"
* Blue circle: "easy"
* Blue line: "easy fit (R^2: 0.829)"
* Orange square: "tricky"
* Orange dashed line: "tricky fit (R^2: 0.903)"
### Detailed Analysis
* **"easy" data series (blue circles):**
* Trend: Generally increasing as "Problem Size" increases.
* Data points:
* (20, ~2000)
* (25, ~3000)
* (25, ~5000)
* (30, ~4000)
* (35, ~6000)
* (40, ~7000)
* (45, ~6000)
* (50, ~9000)
* (50, ~13000)
* (55, ~12000)
* (60, ~13000)
* (65, ~12000)
* (70, ~23000)
* (80, ~13000)
* (80, ~18000)
* "easy fit (R^2: 0.829)": A blue line that represents the linear regression fit for the "easy" data points. The line starts at approximately (15, 0) and ends at approximately (80, 18000).
* **"tricky" data series (orange squares):**
* Trend: Generally increasing as "Problem Size" increases, with a steeper slope than the "easy" series.
* Data points:
* (20, ~2000)
* (20, ~4000)
* (25, ~3000)
* (25, ~5000)
* (30, ~5000)
* (30, ~8000)
* (35, ~10000)
* (40, ~12000)
* (45, ~13000)
* (50, ~13000)
* (50, ~21000)
* (55, ~17000)
* (60, ~18000)
* (70, ~33000)
* (80, ~29000)
* "tricky fit (R^2: 0.903)": An orange dashed line that represents the linear regression fit for the "tricky" data points. The line starts at approximately (15, 0) and ends at approximately (80, 30000).
### Key Observations
* Both "easy" and "tricky" problems show a positive correlation between "Problem Size" and "Reasoning Tokens".
* The "tricky" problems generally require more "Reasoning Tokens" than "easy" problems for a given "Problem Size".
* The R-squared value for the "tricky fit" (0.903) is higher than that of the "easy fit" (0.829), indicating a stronger linear relationship between "Problem Size" and "Reasoning Tokens" for "tricky" problems.
### Interpretation
The data suggests that as the size of a problem increases, the number of reasoning tokens required to solve it also increases. "Tricky" problems require more reasoning tokens than "easy" problems of the same size, indicating that they are inherently more complex and demand more cognitive resources. The higher R-squared value for the "tricky" problems suggests that the relationship between problem size and reasoning tokens is more consistent and predictable for "tricky" problems compared to "easy" problems. This could be because the "easy" problems have more variability in their structure or solution paths, leading to a less consistent relationship.