## Scatter Plot with Trend Lines: Difficulty vs. Reasoning Tokens
### Overview
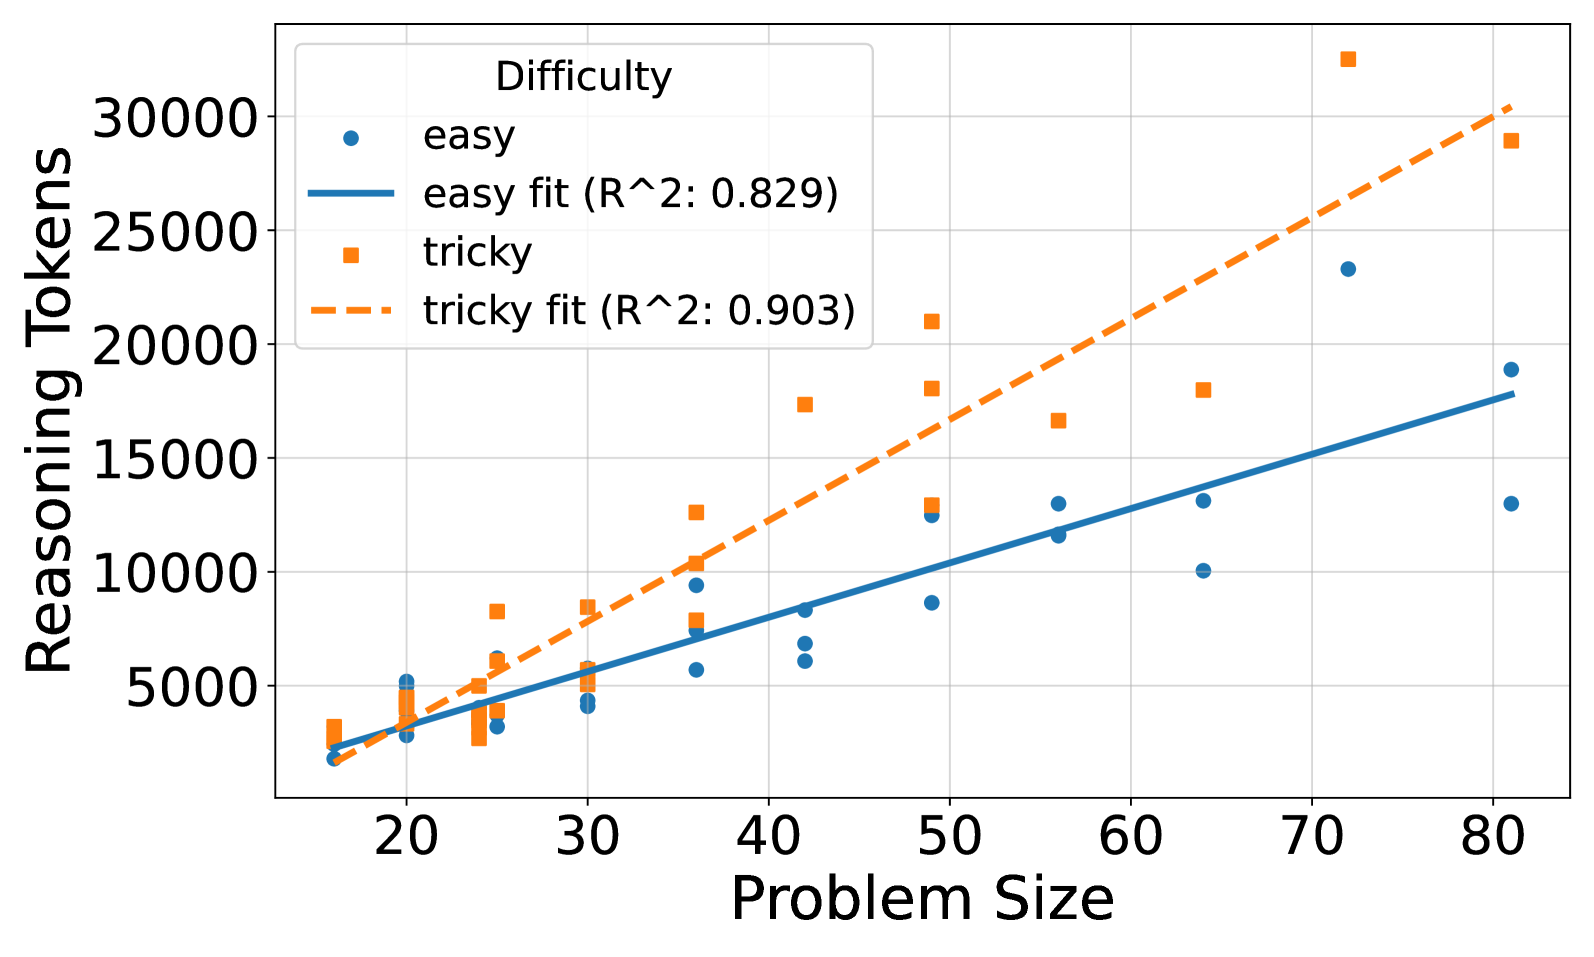
The image is a scatter plot chart displaying the relationship between "Problem Size" (x-axis) and "Reasoning Tokens" (y-axis) for two categories of problems: "easy" and "tricky". Each category has a set of data points and a corresponding linear regression trend line. The chart includes a legend, axis labels, and a grid.
### Components/Axes
* **Chart Title/Legend Title:** "Difficulty" (located in the top-left corner of the plot area).
* **X-Axis:**
* **Label:** "Problem Size"
* **Scale:** Linear, ranging from approximately 15 to 85.
* **Major Tick Marks:** 20, 30, 40, 50, 60, 70, 80.
* **Y-Axis:**
* **Label:** "Reasoning Tokens"
* **Scale:** Linear, ranging from 0 to over 30,000.
* **Major Tick Marks:** 0, 5000, 10000, 15000, 20000, 25000, 30000.
* **Legend (Top-Left):**
* **Series 1:** "easy" - Represented by blue circle markers (●).
* **Series 2:** "easy fit (R^2: 0.829)" - Represented by a solid blue line (—).
* **Series 3:** "tricky" - Represented by orange square markers (■).
* **Series 4:** "tricky fit (R^2: 0.903)" - Represented by a dashed orange line (--).
* **Grid:** Light gray grid lines are present for both major x and y ticks.
### Detailed Analysis
**Trend Verification & Data Series:**
1. **"easy" Series (Blue Circles & Solid Line):**
* **Visual Trend:** The data points show a clear upward trend. The solid blue trend line slopes upward from left to right, indicating a positive correlation between Problem Size and Reasoning Tokens for easy problems.
* **Approximate Data Points (Selected):**
* At Problem Size ~18: Reasoning Tokens ~2,000.
* At Problem Size ~30: Reasoning Tokens ~4,000.
* At Problem Size ~50: Reasoning Tokens ~8,500.
* At Problem Size ~65: Reasoning Tokens ~10,000 and ~13,000 (two points).
* At Problem Size ~81: Reasoning Tokens ~13,000 and ~19,000 (two points).
* **Fit Line:** The solid blue line represents a linear fit with an R-squared value of 0.829, suggesting a reasonably strong linear relationship.
2. **"tricky" Series (Orange Squares & Dashed Line):**
* **Visual Trend:** The data points also show a strong upward trend, generally positioned above the "easy" points for similar Problem Sizes. The dashed orange trend line slopes upward more steeply than the "easy" line.
* **Approximate Data Points (Selected):**
* At Problem Size ~18: Reasoning Tokens ~3,000.
* At Problem Size ~30: Reasoning Tokens ~5,500 and ~8,500.
* At Problem Size ~42: Reasoning Tokens ~17,500.
* At Problem Size ~49: Reasoning Tokens ~13,000, ~18,000, and ~21,000.
* At Problem Size ~72: Reasoning Tokens ~33,000 (a notable high point).
* At Problem Size ~81: Reasoning Tokens ~29,000.
* **Fit Line:** The dashed orange line represents a linear fit with an R-squared value of 0.903, indicating a very strong linear relationship, slightly stronger than for the "easy" category.
**Spatial Grounding:** The legend is positioned in the top-left quadrant of the chart area. The "tricky" data points and trend line are consistently positioned above the "easy" data points and trend line across the entire range of Problem Size, indicating higher Reasoning Token counts for "tricky" problems at any given size.
### Key Observations
1. **Positive Correlation:** Both "easy" and "tricky" problem categories show a positive, linear correlation between Problem Size and the number of Reasoning Tokens required.
2. **Differential Slope:** The slope of the "tricky" fit line is steeper than that of the "easy" fit line. This suggests that as Problem Size increases, the *additional* Reasoning Tokens required for "tricky" problems grows at a faster rate than for "easy" problems.
3. **Variance:** There is noticeable variance in the data points around the trend lines, particularly for the "tricky" category at mid-to-high Problem Sizes (e.g., around Problem Size 49 and 65).
4. **Outlier:** A single "tricky" data point at approximately Problem Size 72 has an exceptionally high Reasoning Token count (~33,000), which is the highest value on the chart.
5. **Goodness of Fit:** Both linear models fit their respective data well, with R-squared values of 0.829 ("easy") and 0.903 ("tricky").
### Interpretation
The data demonstrates that the computational effort (measured in Reasoning Tokens) required to solve a problem scales linearly with the problem's size. Crucially, the problem's difficulty category ("easy" vs. "tricky") acts as a multiplier on this scaling factor.
The steeper slope for "tricky" problems implies they are not just uniformly harder, but that their complexity compounds more severely with size. A large "tricky" problem demands a disproportionately larger reasoning overhead compared to a large "easy" problem, beyond the simple increase due to size alone. This has practical implications for resource allocation and performance prediction in systems that process such problems; one cannot extrapolate the cost of a large "tricky" problem from the cost of a small one using the same rate derived from "easy" problems. The high R-squared values suggest that Problem Size is a very reliable predictor of Reasoning Tokens within each difficulty class, making this a useful model for estimation.