\n
## Line Chart: Number of Responsive Plugs Over Time
### Overview
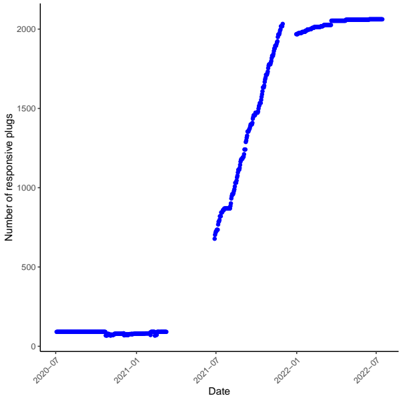
The image presents a line chart illustrating the number of responsive plugs over a period from approximately July 2020 to July 2022. The chart shows a relatively flat trend for the first year, followed by a steep increase, and then a leveling off.
### Components/Axes
* **X-axis:** Labeled "Date", spanning from approximately July 2020 to July 2022. The axis is marked with approximate dates: 2020-07, 2021-01, 2021-07, 2022-01, and 2022-07.
* **Y-axis:** Labeled "Number of responsive plugs", ranging from 0 to 2000, with increments of 500.
* **Data Series:** A single blue line representing the number of responsive plugs.
* **No Legend:** There is no explicit legend, but the Y-axis label clearly identifies the data represented by the line.
### Detailed Analysis
The blue line representing the number of responsive plugs exhibits the following trend:
* **2020-07 to 2021-01:** The line remains relatively flat, fluctuating between approximately 0 and 100 responsive plugs.
* **2021-01 to 2021-07:** The line remains relatively flat, fluctuating between approximately 0 and 150 responsive plugs.
* **2021-07 to 2022-01:** A steep upward trend is observed, increasing from approximately 600 to 2000 responsive plugs.
* **2022-01 to 2022-07:** The line plateaus, fluctuating between approximately 1900 and 2000 responsive plugs.
Approximate data points:
* 2020-07: ~20 responsive plugs
* 2021-01: ~50 responsive plugs
* 2021-07: ~120 responsive plugs
* 2022-01: ~1900 responsive plugs
* 2022-07: ~2000 responsive plugs
### Key Observations
* The most significant change occurs between July 2021 and January 2022, with a rapid increase in the number of responsive plugs.
* The number of responsive plugs stabilizes after January 2022, indicating a saturation point or completion of a deployment phase.
* The initial period (July 2020 - July 2021) shows minimal growth in responsive plugs.
### Interpretation
The data suggests a phased rollout or adoption of "responsive plugs." The initial flat period likely represents a pilot program or limited initial deployment. The steep increase starting in July 2021 indicates a broader implementation or increased adoption rate. The subsequent leveling off suggests that the deployment has reached a significant level of completion or that the target market has been largely saturated. The data could be used to assess the success of the rollout, identify potential bottlenecks in the initial phase, and forecast future growth based on the stabilization trend. It would be useful to have additional context regarding what constitutes a "responsive plug" and the factors driving its adoption to provide a more comprehensive interpretation.