TECHNICAL ASSET FINGERPRINT
9d5bdf91b6f70a57d5a0f113
Click to view fullscreen
Press ESC or click to close
FOUND IN PAPERS
EXPERT: healer-alpha-free VERSION 1
RUNTIME: free/openrouter/healer-alpha
INTEL_VERIFIED
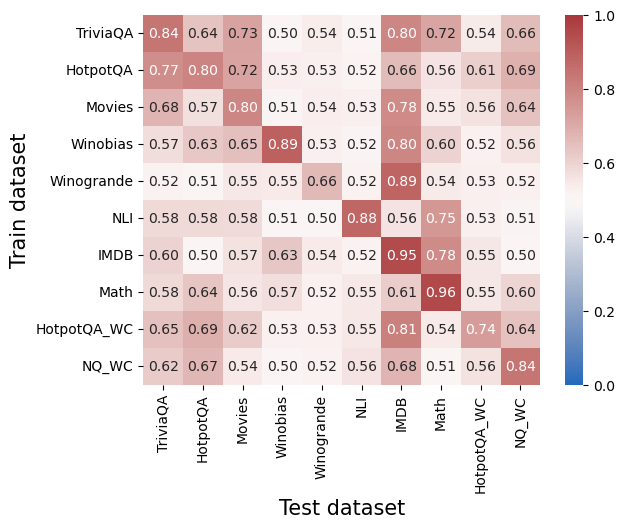
## Heatmap: Cross-Dataset Performance Matrix
### Overview
The image is a heatmap visualization displaying numerical performance scores (likely accuracy or a similar metric) for various machine learning models or systems. The matrix compares performance when a model is trained on one dataset (rows) and tested on another (columns). The values range from 0.0 to 1.0, with a color gradient from blue (low) to red (high) indicating the score.
### Components/Axes
* **Y-Axis (Vertical):** Labeled **"Train dataset"**. It lists 10 distinct training datasets:
* TriviaQA
* HotpotQA
* Movies
* Winobias
* Winogrande
* NLI
* IMDB
* Math
* HotpotQA_WC
* NQ_WC
* **X-Axis (Horizontal):** Labeled **"Test dataset"**. It lists the same 10 datasets in the same order as the y-axis, creating a square matrix.
* **Color Bar/Legend:** Positioned vertically on the **right side** of the chart. It provides a scale from **0.0 (blue)** to **1.0 (dark red)**, with intermediate markers at 0.2, 0.4, 0.6, and 0.8. This legend is used to interpret the color intensity of each cell in the heatmap.
* **Data Cells:** A 10x10 grid where each cell contains a numerical value and is colored according to the scale. The value represents the performance score for the corresponding Train-Test dataset pair.
### Detailed Analysis
The following table reconstructs the heatmap's data. Rows represent the **Train dataset**, and columns represent the **Test dataset**. Values are transcribed directly from the image.
| Train \ Test | TriviaQA | HotpotQA | Movies | Winobias | Winogrande | NLI | IMDB | Math | HotpotQA_WC | NQ_WC |
| :--- | :---: | :---: | :---: | :---: | :---: | :---: | :---: | :---: | :---: | :---: |
| **TriviaQA** | 0.84 | 0.64 | 0.73 | 0.50 | 0.54 | 0.51 | 0.80 | 0.72 | 0.54 | 0.66 |
| **HotpotQA** | 0.77 | 0.80 | 0.72 | 0.53 | 0.53 | 0.52 | 0.66 | 0.56 | 0.61 | 0.69 |
| **Movies** | 0.68 | 0.57 | 0.80 | 0.51 | 0.54 | 0.53 | 0.78 | 0.55 | 0.56 | 0.64 |
| **Winobias** | 0.57 | 0.63 | 0.65 | **0.89** | 0.53 | 0.52 | 0.80 | 0.60 | 0.52 | 0.56 |
| **Winogrande** | 0.52 | 0.51 | 0.55 | 0.55 | **0.66** | 0.52 | 0.89 | 0.54 | 0.53 | 0.52 |
| **NLI** | 0.58 | 0.58 | 0.58 | 0.51 | 0.50 | **0.88** | 0.56 | 0.75 | 0.53 | 0.51 |
| **IMDB** | 0.60 | 0.50 | 0.57 | 0.63 | 0.54 | 0.52 | **0.95** | 0.78 | 0.55 | 0.50 |
| **Math** | 0.58 | 0.64 | 0.56 | 0.57 | 0.52 | 0.55 | 0.61 | **0.96** | 0.55 | 0.60 |
| **HotpotQA_WC** | 0.65 | 0.69 | 0.62 | 0.53 | 0.53 | 0.55 | 0.81 | 0.54 | **0.74** | 0.64 |
| **NQ_WC** | 0.62 | 0.67 | 0.54 | 0.50 | 0.52 | 0.56 | 0.68 | 0.51 | 0.56 | **0.84** |
**Trend Verification by Row (Train Dataset):**
* **TriviaQA:** Shows high performance on itself (0.84) and IMDB (0.80), moderate on Movies (0.73) and Math (0.72), and lower on others.
* **HotpotQA:** Strong on itself (0.80) and TriviaQA (0.77), moderate on NQ_WC (0.69), and lower elsewhere.
* **Movies:** Peaks on itself (0.80) and IMDB (0.78), moderate on TriviaQA (0.68), and lower on others.
* **Winobias:** Has a very high score on itself (0.89) and a high score on IMDB (0.80), with other scores being moderate to low.
* **Winogrande:** Shows a very high score on IMDB (0.89) and a moderate score on itself (0.66), with other scores generally low.
* **NLI:** Peaks sharply on itself (0.88) and has a relatively high score on Math (0.75), with other scores low.
* **IMDB:** Has an extremely high score on itself (0.95) and a high score on Math (0.78), with other scores moderate to low.
* **Math:** Has the highest score in the entire matrix on itself (0.96), with other scores generally low to moderate.
* **HotpotQA_WC:** Performs best on itself (0.74) and IMDB (0.81), with moderate scores on its non-WC counterpart (0.69) and TriviaQA (0.65).
* **NQ_WC:** Peaks on itself (0.84) and shows moderate performance on HotpotQA (0.67) and IMDB (0.68).
### Key Observations
1. **Diagonal Dominance:** The highest value in each row is almost always on the main diagonal (where Train and Test datasets are the same). This indicates models perform best when tested on the same domain they were trained on.
2. **Strong Cross-Domain Pairs:** Several train-test pairs show notably high performance despite being different datasets:
* **IMDB as a Test Set:** It yields high scores (≥0.78) for models trained on Winobias, Winogrande, Movies, IMDB, and HotpotQA_WC.
* **Math as a Test Set:** It yields high scores for models trained on NLI (0.75) and IMDB (0.78).
* **TriviaQA & HotpotQA:** These show moderate to high mutual performance.
3. **Weak Cross-Domain Pairs:** Performance is generally low (<0.60) when models trained on reasoning-heavy datasets (Winobias, Winogrande, NLI, Math) are tested on QA datasets (TriviaQA, HotpotQA, NQ_WC), and vice-versa.
4. **WC Variant Behavior:** The "_WC" (likely "Without Context") datasets show interesting patterns. HotpotQA_WC performs better on IMDB than its standard counterpart. NQ_WC performs better on HotpotQA than the standard NQ model likely would.
### Interpretation
This heatmap provides a detailed map of **domain generalization** and **transfer learning** capabilities across a suite of NLP benchmarks.
* **What it demonstrates:** The data strongly suggests that the underlying models or systems are highly specialized. The pronounced diagonal indicates that knowledge learned from a specific dataset does not transfer perfectly to others, highlighting the challenge of creating general-purpose models. The high scores on the diagonal represent "in-domain" performance, while off-diagonal scores represent "out-of-domain" generalization.
* **Relationships between elements:** The matrix reveals clusters of related tasks. For example, the QA datasets (TriviaQA, HotpotQA, NQ_WC) form a loose cluster with moderate mutual transfer. Similarly, the coreference/reasoning datasets (Winobias, Winogrande) show some transfer to each other and to IMDB. The IMDB dataset acts as a surprisingly good general test set for several model types, suggesting its sentiment analysis task may share underlying features with other tasks.
* **Notable anomalies and insights:**
* The **Math** dataset is an outlier in its self-performance (0.96) but shows poor generalization to most other tasks, suggesting it requires highly specialized knowledge.
* The **IMDB** dataset's role as a strong transfer target is a key finding. It may be a simpler or more fundamental task that benefits many models.
* The **NLI** model's strong performance on **Math** (0.75) is intriguing and may indicate that natural language inference skills are beneficial for mathematical reasoning tasks.
* The **"_WC"** variants show that removing context alters generalization patterns, sometimes improving transfer to certain domains (e.g., HotpotQA_WC to IMDB).
In essence, this matrix is a diagnostic tool for understanding the strengths, weaknesses, and interconnectedness of different NLP tasks and the models trained on them. It underscores that achieving robust, general AI requires moving beyond high diagonal scores to improve the off-diagonal generalization.
DECODING INTELLIGENCE...