\n
## Histogram: Distribution of Average Factuality per Document
### Overview
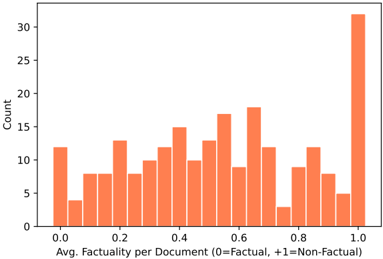
The image presents a histogram visualizing the distribution of average factuality scores across a collection of documents. The x-axis represents the average factuality score, ranging from 0.0 to 1.0, where 0 indicates fully factual and 1 indicates fully non-factual. The y-axis represents the count, or frequency, of documents falling within each factuality score bin. The histogram uses a single data series, displayed as orange bars.
### Components/Axes
* **X-axis Title:** "Avg. Factuality per Document (0=Factual, +1=Non-Factual)"
* **Y-axis Title:** "Count"
* **X-axis Scale:** Ranges from 0.0 to 1.0, with increments of approximately 0.1.
* **Y-axis Scale:** Ranges from 0 to 30, with increments of 5.
* **Data Series:** A single series of orange bars representing the frequency distribution of average factuality scores.
### Detailed Analysis
The histogram shows a roughly symmetrical distribution, but with a slight skew towards higher factuality scores (values closer to 0). The distribution is not uniform; there are peaks and valleys indicating varying concentrations of documents at different factuality levels.
Here's an approximate breakdown of the counts for each bin (estimated from the bar heights):
* 0.0 - 0.1: ~11
* 0.1 - 0.2: ~8
* 0.2 - 0.3: ~10
* 0.3 - 0.4: ~14
* 0.4 - 0.5: ~15
* 0.5 - 0.6: ~17
* 0.6 - 0.7: ~16
* 0.7 - 0.8: ~8
* 0.8 - 0.9: ~10
* 0.9 - 1.0: ~32
The highest concentration of documents falls within the 0.9-1.0 range, with approximately 32 documents. The lowest concentration is in the 0.7-0.8 range, with approximately 8 documents. The distribution peaks around 0.5-0.7.
### Key Observations
* The distribution is not centered at 0.5, suggesting that, on average, the documents lean towards being factual.
* There's a significant number of documents with very high factuality scores (close to 1.0), indicating a substantial portion of the collection is non-factual.
* The shape of the distribution suggests a complex interplay of factors influencing the factuality of the documents.
### Interpretation
The data suggests that the collection of documents exhibits a wide range of factuality, with a noticeable tendency towards non-factual content. The peak around 0.5-0.7 indicates that a significant portion of the documents fall into a moderate factuality range, while the substantial number of documents with scores close to 1.0 raises concerns about the prevalence of misinformation or non-factual content within the collection. The distribution's shape could be due to various factors, such as the source of the documents, the topic they cover, or the methods used to assess their factuality. Further investigation would be needed to understand the underlying reasons for this distribution and to identify potential biases or patterns in the data. The factuality scores are likely derived from some automated or human assessment process, and the distribution reflects the outcomes of that process.