## Bar Chart: Distribution of Average Factuality per Document
### Overview
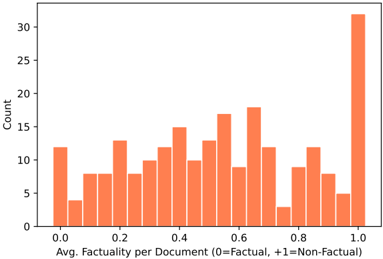
The chart displays a histogram showing the distribution of average factuality scores across documents. The x-axis represents the average factuality score (ranging from 0.0 [fully factual] to 1.0 [fully non-factual]), while the y-axis shows the count of documents falling into each score bin. The data is visualized using orange bars, with a single legend confirming the color mapping.
### Components/Axes
- **X-Axis**: "Avg. Factuality per Document (0=Factual, +1=Non-Factual)"
- Scale: 0.0 to 1.0 in increments of 0.1
- Position: Bottom of the chart
- **Y-Axis**: "Count"
- Scale: 0 to 30 in increments of 5
- Position: Left side of the chart
- **Legend**:
- Color: Orange
- Label: "Data" (implied by context)
- Position: Bottom-right corner
### Detailed Analysis
- **Data Points**:
- **0.0**: ~12 documents
- **0.1**: ~4 documents
- **0.2**: ~8 documents
- **0.3**: ~8 documents
- **0.4**: ~13 documents
- **0.5**: ~10 documents
- **0.6**: ~18 documents
- **0.7**: ~12 documents
- **0.8**: ~3 documents
- **0.9**: ~9 documents
- **1.0**: ~32 documents
### Key Observations
1. **Peak at 1.0**: The tallest bar (32 documents) occurs at the maximum non-factuality score (1.0), indicating a significant number of fully non-factual documents.
2. **Secondary Peaks**: Notable counts at 0.6 (~18) and 0.4 (~13), suggesting clusters of moderately non-factual content.
3. **Low Counts at Extremes**: Very few documents at 0.0 (12) and 0.1 (4), implying rare fully factual content.
4. **General Trend**: Counts increase as factuality decreases, with a sharp rise near 1.0.
### Interpretation
The data suggests a strong skew toward non-factual content in the dataset. The sharp increase in document counts at higher non-factuality scores (e.g., 0.8–1.0) indicates that most documents contain substantial inaccuracies or falsehoods. The scarcity of fully factual documents (0.0–0.1) highlights potential quality issues in the dataset. This distribution could reflect challenges in content verification or biases in data collection. The outlier at 1.0 (32 documents) warrants further investigation to determine if these represent systemic errors or intentional misinformation.