## Network Diagrams & Charts: Memristor Network Performance
### Overview
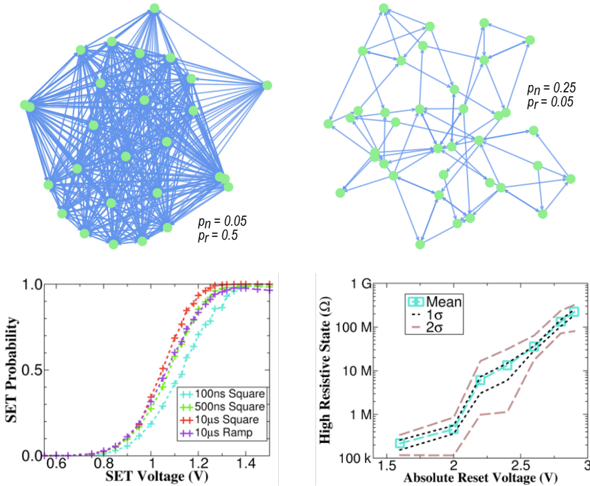
The image presents a combination of network diagrams illustrating memristor network configurations and two charts detailing the performance characteristics of these networks. The diagrams show connectivity patterns with associated probabilities, while the charts depict SET probability versus SET voltage and high resistive state versus absolute reset voltage.
### Components/Axes
**Network Diagrams:**
* **Nodes:** Represented by green circles.
* **Connections:** Represented by light blue lines.
* **Labels:** `pn = 0.05`, `pr = 0.5` (left diagram); `pn = 0.25`, `pr = 0.05` (right diagram). These likely represent the probability of a node being 'on' (pn) and the probability of a connection existing (pr).
**Chart 1: SET Probability vs. SET Voltage**
* **X-axis:** SET Voltage (V), ranging from approximately 0.6 to 1.45 V.
* **Y-axis:** SET Probability, ranging from approximately 0.0 to 1.0.
* **Data Series:**
* 100ns Square (cyan 'x' markers)
* 500ns Square (green '+' markers)
* 10µs Square (light blue '*' markers)
* 10µs Ramp (purple diamond markers)
**Chart 2: High Resistive State vs. Absolute Reset Voltage**
* **X-axis:** Absolute Reset Voltage (V), ranging from approximately 1.5 to 3.0 V.
* **Y-axis:** High Resistive State (Ω), on a logarithmic scale ranging from 100 kΩ to 100 MΩ.
* **Legend:**
* Mean (solid black line)
* 1σ (dashed cyan line)
* 2σ (dashed-dotted brown line)
### Detailed Analysis or Content Details
**Network Diagrams:**
The left diagram shows a denser network with `pn = 0.05` and `pr = 0.5`. The right diagram shows a sparser network with `pn = 0.25` and `pr = 0.05`. The diagrams visually represent the connectivity of the memristor network.
**Chart 1: SET Probability vs. SET Voltage**
* **100ns Square:** The SET probability increases rapidly between approximately 0.8V and 1.1V, reaching near 1.0 by 1.2V.
* **500ns Square:** The SET probability increases more gradually than the 100ns Square, starting to increase noticeably around 0.9V and reaching near 1.0 by 1.3V.
* **10µs Square:** The SET probability increases very gradually, starting to increase around 1.0V and reaching near 1.0 by 1.4V.
* **10µs Ramp:** The SET probability increases rapidly, similar to the 100ns Square, starting around 0.75V and reaching near 1.0 by 1.2V.
**Chart 2: High Resistive State vs. Absolute Reset Voltage**
* **Mean:** The mean high resistive state increases rapidly between approximately 1.7V and 2.2V, then increases more slowly until 3.0V, reaching approximately 80 MΩ.
* **1σ:** The 1σ curve starts at approximately 200 kΩ at 1.5V, increases rapidly to approximately 1 MΩ at 2.0V, and then increases more slowly to approximately 20 MΩ at 3.0V.
* **2σ:** The 2σ curve starts at approximately 100 kΩ at 1.5V, increases rapidly to approximately 500 kΩ at 2.0V, and then increases more slowly to approximately 5 MΩ at 3.0V.
### Key Observations
* Shorter pulse durations (100ns, 500ns) for the square wave exhibit faster SET probabilities compared to the longer 10µs square wave.
* The 10µs ramp waveform shows a SET probability curve similar to the 100ns square wave.
* The high resistive state increases significantly with increasing reset voltage.
* The 1σ and 2σ curves show the variability in the high resistive state, with the spread increasing with reset voltage.
### Interpretation
The data suggests that the SET probability is highly dependent on the pulse duration and waveform shape. Shorter pulses and ramp waveforms are more effective at setting the memristors. The high resistive state is also strongly influenced by the reset voltage, with higher voltages leading to higher resistance. The spread in the high resistive state (represented by 1σ and 2σ) indicates the inherent variability in the memristor devices.
The network diagrams show how the connectivity of the network can be controlled by adjusting the probabilities of node activation (`pn`) and connection formation (`pr`). The denser network (left diagram) with `pr = 0.5` likely exhibits different behavior than the sparser network (right diagram) with `pr = 0.05`. The combination of network topology and device characteristics (SET/Reset behavior) is crucial for designing and optimizing memristor-based systems. The charts provide insights into the electrical characteristics of the memristors, which are essential for understanding and predicting the behavior of the network. The logarithmic scale on the Y-axis of the second chart highlights the large dynamic range of the memristor's resistance.