\n
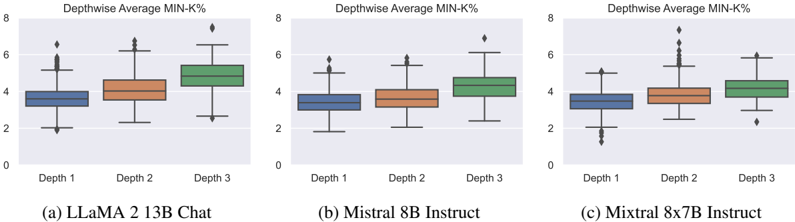
## Box Plots: Depthwise Average MIN-K% for LLMs
### Overview
The image presents three box plots, each representing the distribution of "Depthwise Average MIN-K%" for different Large Language Models (LLMs) across three depths (Depth 1, Depth 2, Depth 3). The LLMs being compared are: (a) LLaMA 2 13B Chat, (b) Mistral 8B Instruct, and (c) Mixtral 8x7B Instruct. Each box plot visualizes the median, quartiles, and outliers of the metric for each depth.
### Components/Axes
* **Title:** "Depthwise Average MIN-K%" (appears above each plot)
* **X-axis:** "Depth" with markers "Depth 1", "Depth 2", and "Depth 3".
* **Y-axis:** Scale ranging from 0 to 8, with increments of 1.
* **Box Plot Components:** Each box represents the interquartile range (IQR), with a line indicating the median. Whiskers extend to show the range of the data, and points beyond the whiskers represent outliers.
* **Labels:** Below each plot, the corresponding LLM is labeled: (a) LLaMA 2 13B Chat, (b) Mistral 8B Instruct, (c) Mixtral 8x7B Instruct.
### Detailed Analysis or Content Details
**Plot (a): LLaMA 2 13B Chat**
* **Depth 1:** The box plot is centered around approximately 3.6. The IQR ranges from roughly 3.2 to 4.2. There are no visible outliers.
* **Depth 2:** The box plot is centered around approximately 4.4. The IQR ranges from roughly 4.0 to 4.8. There are no visible outliers.
* **Depth 3:** The box plot is centered around approximately 5.2. The IQR ranges from roughly 4.8 to 5.8. There is one outlier at approximately 7.2.
**Plot (b): Mistral 8B Instruct**
* **Depth 1:** The box plot is centered around approximately 3.5. The IQR ranges from roughly 3.1 to 4.0. There are no visible outliers.
* **Depth 2:** The box plot is centered around approximately 4.3. The IQR ranges from roughly 3.9 to 4.7. There are no visible outliers.
* **Depth 3:** The box plot is centered around approximately 5.1. The IQR ranges from roughly 4.7 to 5.6. There is one outlier at approximately 6.6.
**Plot (c): Mixtral 8x7B Instruct**
* **Depth 1:** The box plot is centered around approximately 3.7. The IQR ranges from roughly 3.3 to 4.3. There are no visible outliers.
* **Depth 2:** The box plot is centered around approximately 4.5. The IQR ranges from roughly 4.1 to 4.9. There are no visible outliers.
* **Depth 3:** The box plot is centered around approximately 5.3. The IQR ranges from roughly 4.9 to 5.9. There is one outlier at approximately 7.0.
In all three plots, the median value increases as the depth increases. The spread of the data (as indicated by the IQR) also appears to increase with depth.
### Key Observations
* The median "Depthwise Average MIN-K%" consistently increases with depth for all three LLMs.
* The range of values (as indicated by the whiskers) also tends to increase with depth.
* Outliers are present only at Depth 3 for all three models, suggesting that deeper processing may lead to more variable results.
* Mixtral 8x7B Instruct generally exhibits slightly higher median values compared to LLaMA 2 13B Chat and Mistral 8B Instruct across all depths.
### Interpretation
The data suggests that as the processing depth increases, the "Depthwise Average MIN-K%" metric also increases for all three LLMs. This metric likely represents some measure of performance or quality, and the increasing trend indicates that deeper processing leads to improvements in this aspect. The presence of outliers at Depth 3 suggests that while deeper processing generally improves performance, it can also introduce more variability or instability.
The slight difference in median values between the models suggests that Mixtral 8x7B Instruct may be slightly more effective at leveraging deeper processing compared to the other two models. However, further analysis would be needed to determine the statistical significance of this difference.
The box plots provide a concise visual summary of the distribution of this metric for each model and depth, allowing for easy comparison and identification of trends. The consistent trend across all models suggests a general principle about the relationship between processing depth and performance.