## Bar Chart: Effective Bandwidth Comparison Between DAK and FlexGen
### Overview
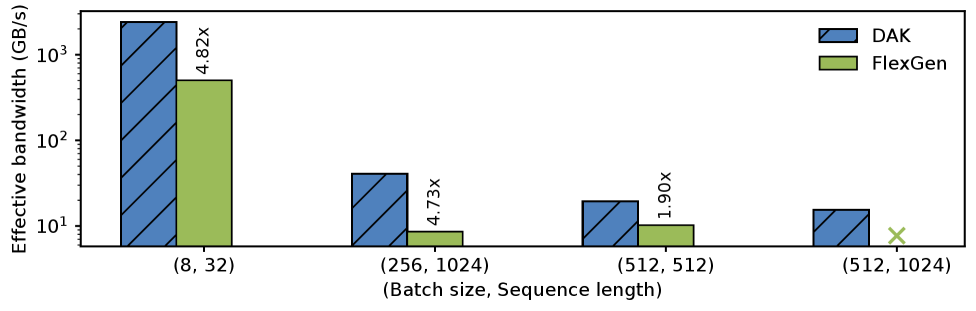
The chart compares the effective bandwidth (in GB/s) of two methods, DAK and FlexGen, across four configurations of batch size and sequence length. The y-axis uses a logarithmic scale (10^1 to 10^3), and the x-axis categorizes configurations as (Batch size, Sequence length). Each configuration has two bars: DAK (blue with diagonal stripes) and FlexGen (green). A legend in the top-right corner identifies the methods.
### Components/Axes
- **Y-axis**: "Effective bandwidth (GB/s)" with logarithmic scale (10^1 to 10^3).
- **X-axis**: Four configurations:
1. (8, 32)
2. (256, 1024)
3. (512, 512)
4. (512, 1024)
- **Legend**: Top-right corner, labels:
- Blue (diagonal stripes): DAK
- Green: FlexGen
### Detailed Analysis
1. **(8, 32)**:
- DAK: ~1000 GB/s (bar height near 10^3).
- FlexGen: ~500 GB/s (bar height between 10^2 and 10^3).
- Multipliers: DAK = 4.82x, FlexGen = 4.73x.
2. **(256, 1024)**:
- DAK: ~50 GB/s (bar height near 10^1.7).
- FlexGen: ~10 GB/s (bar height near 10^1).
- Multipliers: DAK = 4.73x, FlexGen = 1.90x.
3. **(512, 512)**:
- DAK: ~20 GB/s (bar height near 10^1.3).
- FlexGen: ~10 GB/s (bar height near 10^1).
- Multipliers: DAK = 1.90x, FlexGen = 1.90x.
4. **(512, 1024)**:
- DAK: ~10 GB/s (bar height near 10^1).
- FlexGen: No data (marked with "X").
- Multipliers: DAK = 1.90x, FlexGen = N/A.
### Key Observations
- **DAK consistently outperforms FlexGen** in all configurations where data is available.
- **Effective bandwidth decreases** as batch size and sequence length increase for both methods.
- **Multipliers** (likely indicating performance gains relative to a baseline) decrease with larger configurations, suggesting diminishing returns.
- **FlexGen lacks data** for the (512, 1024) configuration, marked with an "X".
### Interpretation
The data suggests that **DAK is more efficient** than FlexGen across tested configurations, with the largest performance gap in smaller setups (e.g., 4.82x multiplier in (8,32)). As configurations scale, both methods experience reduced bandwidth, but DAK maintains a higher relative performance. The absence of FlexGen data in the largest configuration (512,1024) may indicate technical limitations or instability under those parameters. The logarithmic y-axis emphasizes the exponential drop in bandwidth with increased computational demands.