## Diagram: Neural Network Layer
### Overview
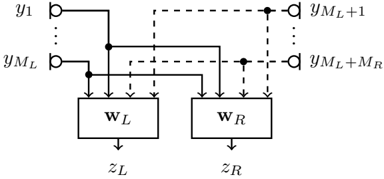
The image is a diagram representing a layer in a neural network, specifically showing how inputs are processed by two weight matrices, W_L and W_R, to produce outputs z_L and z_R. The diagram illustrates the connections between input nodes (y_1 to y_{M_L} and y_{M_L+1} to y_{M_L+M_R}) and the weight matrices.
### Components/Axes
* **Input Nodes:**
* `y_1`: Top-left input node.
* `y_{M_L}`: Bottom-left input node.
* `y_{M_L+1}`: Top-right input node.
* `y_{M_L+M_R}`: Bottom-right input node.
* **Weight Matrices:**
* `W_L`: Left weight matrix (rectangular box).
* `W_R`: Right weight matrix (rectangular box).
* **Output Nodes:**
* `z_L`: Output from the left weight matrix.
* `z_R`: Output from the right weight matrix.
* **Connections:**
* Solid lines: Connections from the left input nodes to both weight matrices.
* Dashed lines: Connections from the right input nodes to both weight matrices.
### Detailed Analysis
* **Input Nodes:** The input nodes are represented as circles. The left input nodes range from `y_1` to `y_{M_L}`, and the right input nodes range from `y_{M_L+1}` to `y_{M_L+M_R}`.
* **Weight Matrices:** The weight matrices `W_L` and `W_R` are represented as rectangular boxes.
* **Connections:**
* The solid lines indicate connections from the left input nodes (`y_1` to `y_{M_L}`) to both `W_L` and `W_R`. Specifically, two solid lines connect to `W_L` and two solid lines connect to `W_R`.
* The dashed lines indicate connections from the right input nodes (`y_{M_L+1}` to `y_{M_L+M_R}`) to both `W_L` and `W_R`. Specifically, two dashed lines connect to `W_L` and two dashed lines connect to `W_R`.
* **Output Nodes:** The outputs `z_L` and `z_R` are represented as arrows pointing downwards from the weight matrices `W_L` and `W_R`, respectively.
### Key Observations
* The diagram shows a fully connected layer where both `W_L` and `W_R` receive inputs from both the left and right input node groups.
* The use of solid and dashed lines differentiates the origin of the inputs (left vs. right).
* The diagram suggests that the outputs `z_L` and `z_R` are calculated based on the weighted sum of the inputs, using the weight matrices `W_L` and `W_R`, respectively.
### Interpretation
The diagram illustrates a layer in a neural network where inputs are processed by two weight matrices. The inputs are divided into two groups, and each weight matrix receives inputs from both groups. This type of architecture can be used for various purposes, such as feature extraction or dimensionality reduction. The connections between the input nodes and the weight matrices determine how the inputs are combined to produce the outputs. The diagram highlights the flow of information through the layer and the role of the weight matrices in transforming the inputs.