## Charts: Normalized Error vs. Current/Stop Voltage
### Overview
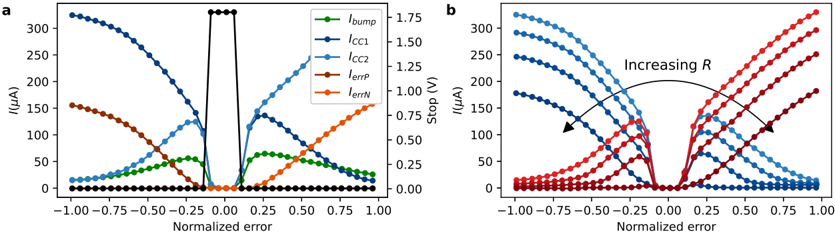
The image presents two charts (labeled 'a' and 'b') displaying relationships between normalized error and various electrical parameters. Chart 'a' shows current-related parameters (Ibump, ICC1, ICC2, IerrP, IerrN) against normalized error, while chart 'b' shows stop voltage (V) and current (I) against normalized error, with an indication of increasing resistance (R). Both charts share a common x-axis representing normalized error ranging from -1.00 to 1.00.
### Components/Axes
**Common Elements:**
* **X-axis:** Normalized error (ranging from -1.00 to 1.00, with markers at -1.00, -0.75, -0.50, -0.25, 0.00, 0.25, 0.50, 0.75, 1.00)
* **Chart Labels:** 'a' and 'b' to distinguish the two charts.
**Chart 'a':**
* **Y-axis:** Current (µA) with a scale from 0 to 300 µA.
* **Legend:** Located in the top-right corner.
* Ibump (Green, Marker: +)
* ICC1 (Blue, Marker: *)
* ICC2 (Orange, Marker: Δ)
* IerrP (Cyan, Marker: □)
* IerrN (Dark Red, Marker: ◊)
**Chart 'b':**
* **Y-axis:** Stop (V) and Current (µA) - two scales are present. The left scale is for Stop Voltage (V) ranging from 0 to 300 V. The right scale is for Current (µA) ranging from 0 to 300 µA.
* **Annotation:** "Increasing R" with an arrow indicating the direction of increasing resistance.
* **Legend:** No explicit legend is present, but the data series are distinguishable by color and marker. The colors match those in chart 'a'.
### Detailed Analysis or Content Details
**Chart 'a':**
* **Ibump (Green):** The line starts at approximately 300 µA at -1.00 normalized error, decreases steadily to approximately 0 µA at 0.25 normalized error, and remains near 0 µA for the rest of the range.
* **ICC1 (Blue):** The line starts at approximately 300 µA at -1.00 normalized error, decreases steadily to approximately 0 µA at 0.75 normalized error, and remains near 0 µA for the rest of the range.
* **ICC2 (Orange):** The line starts at approximately 175 µA at -1.00 normalized error, decreases to approximately 0 µA at 0.50 normalized error, and remains near 0 µA for the rest of the range.
* **IerrP (Cyan):** The line starts at approximately 0 µA at -1.00 normalized error, increases rapidly to approximately 1.50 µA at 0.00 normalized error, and then decreases to approximately 0 µA at 1.00 normalized error.
* **IerrN (Dark Red):** The line starts at approximately 0 µA at -1.00 normalized error, increases to approximately 0.75 µA at 0.00 normalized error, and then decreases to approximately 0 µA at 1.00 normalized error.
**Chart 'b':**
* The chart displays multiple lines, each representing a different value of resistance (R). The lines generally slope downwards from left to right.
* At -1.00 normalized error, the lines start at approximately 300 µA (current scale) or 300 V (voltage scale).
* As normalized error increases towards 1.00, the lines decrease in both current and voltage.
* The lines with higher resistance (indicated by the "Increasing R" annotation) have steeper slopes.
* The lines converge towards approximately 0 µA and 0 V at 1.00 normalized error.
### Key Observations
* In Chart 'a', Ibump, ICC1, and ICC2 all decrease as normalized error increases, indicating a reduction in these currents with increasing error.
* In Chart 'a', IerrP and IerrN increase initially with normalized error, peaking at 0.00, and then decrease, suggesting an error correction mechanism that is most active around zero error.
* Chart 'b' demonstrates that as resistance increases, the current and stop voltage decrease more rapidly with increasing normalized error.
* The convergence of lines in Chart 'b' at 1.00 normalized error suggests a saturation point or a limit to the system's response.
### Interpretation
The data suggests a system where error correction mechanisms (IerrP and IerrN) are employed to minimize the impact of errors (represented by normalized error). The currents Ibump, ICC1, and ICC2 are affected by the error and decrease as the error increases. Chart 'b' indicates that the system's response is sensitive to resistance, with higher resistance leading to a more pronounced decrease in current and voltage as the error increases.
The "Increasing R" annotation and the associated lines suggest a trade-off between sensitivity and stability. Higher resistance provides greater sensitivity to error but also leads to a more rapid decline in performance as the error increases. The convergence of lines at 1.00 normalized error could represent a point where the system reaches its operational limits or where the error correction mechanisms are no longer effective.
The two charts together provide a comprehensive view of the system's behavior under varying error conditions and resistance levels, highlighting the interplay between these factors and their impact on the system's performance. The data could be used to optimize the system's design by selecting an appropriate resistance value that balances sensitivity and stability.