## Line Chart: Surprisal vs. Training Steps for Match and Mismatch Conditions
### Overview
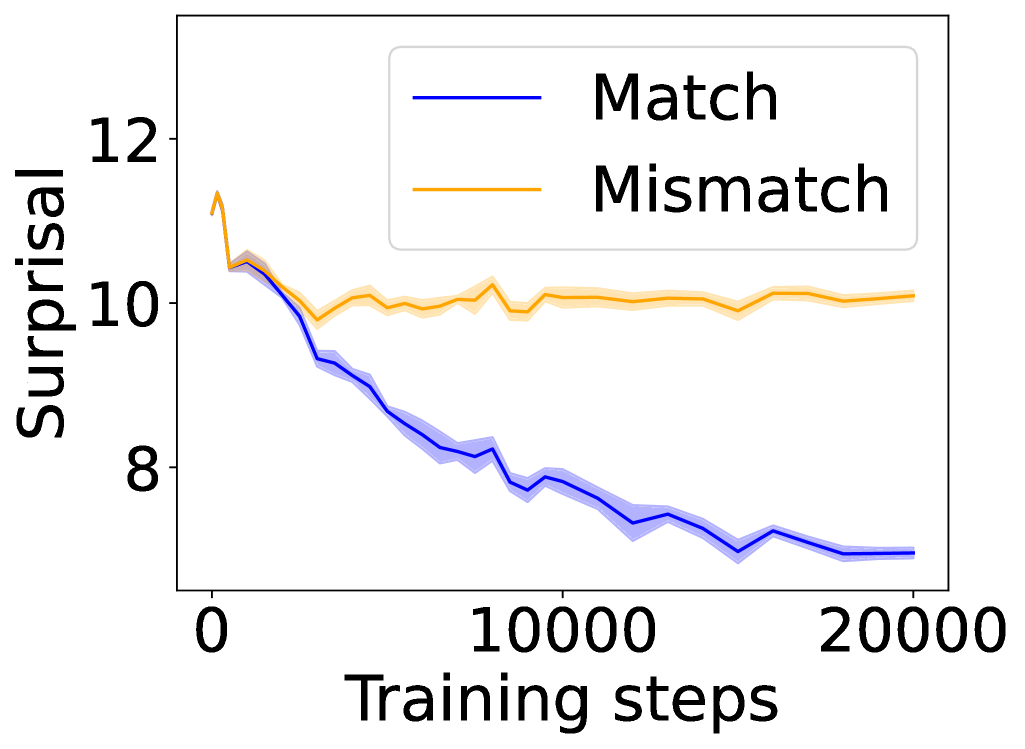
The image displays a line chart comparing the "Surprisal" metric over the course of "Training steps" for two distinct conditions: "Match" and "Mismatch." The chart illustrates how the surprisal value changes for each condition as training progresses from 0 to 20,000 steps.
### Components/Axes
* **Chart Type:** Line chart with shaded confidence intervals or variance bands.
* **X-Axis:**
* **Label:** "Training steps"
* **Scale:** Linear scale.
* **Markers:** Major tick marks and labels at 0, 10000, and 20000.
* **Y-Axis:**
* **Label:** "Surprisal"
* **Scale:** Linear scale.
* **Markers:** Major tick marks and labels at 8, 10, and 12.
* **Legend:**
* **Position:** Top-right corner of the plot area.
* **Entries:**
1. **Match:** Represented by a solid blue line.
2. **Mismatch:** Represented by a solid orange line.
* **Data Series:** Two lines, each with a semi-transparent shaded band of the same color, likely representing standard deviation, standard error, or a confidence interval.
### Detailed Analysis
**1. "Match" Condition (Blue Line):**
* **Trend:** Shows a consistent, strong downward trend across the entire training period.
* **Data Points (Approximate):**
* Step 0: ~10.5
* Step ~2500: ~10.0
* Step ~5000: ~9.0
* Step ~7500: ~8.2
* Step 10000: ~7.8
* Step ~15000: ~7.2
* Step 20000: ~7.0
* **Confidence Band:** The blue shaded area is relatively narrow, suggesting lower variance or higher confidence in the measurement for this condition.
**2. "Mismatch" Condition (Orange Line):**
* **Trend:** Shows an initial sharp decrease, followed by a plateau with minor fluctuations for the remainder of training.
* **Data Points (Approximate):**
* Step 0: ~11.5 (highest initial point)
* Step ~1000: ~10.5
* Step ~2500: ~10.0
* Step ~5000: ~10.0
* Step ~7500: ~10.2
* Step 10000: ~10.0
* Step ~15000: ~10.0
* Step 20000: ~10.0
* **Confidence Band:** The orange shaded area is wider than the blue band, particularly in the later stages of training, indicating greater variance or uncertainty in the surprisal measurements for the mismatch condition.
### Key Observations
1. **Diverging Paths:** The two conditions start at similar, high surprisal values (~10.5-11.5). While the "Match" condition's surprisal decreases steadily, the "Mismatch" condition's surprisal stabilizes at a much higher level (~10.0).
2. **Final Gap:** By 20,000 training steps, a significant gap of approximately 3.0 surprisal units exists between the "Match" (~7.0) and "Mismatch" (~10.0) conditions.
3. **Variance Difference:** The "Mismatch" condition exhibits noticeably higher variance (wider confidence band) throughout training compared to the "Match" condition.
4. **Initial Drop:** Both conditions experience their most rapid decrease in surprisal within the first ~2,500 training steps.
### Interpretation
This chart likely visualizes the performance of a machine learning model during training. "Surprisal" is a measure of how unexpected or difficult a data point is for the model; lower surprisal indicates better prediction or understanding.
* **What the data suggests:** The model is successfully learning from the "Match" condition data, as evidenced by the steadily decreasing surprisal. It becomes progressively better at predicting or processing this type of data. In contrast, the model fails to learn effectively from the "Mismatch" condition after an initial adjustment. The plateau at high surprisal indicates the model finds this data persistently difficult or unpredictable.
* **Relationship between elements:** The diverging lines demonstrate a clear differential in learning outcomes based on the data condition. The wider confidence interval for "Mismatch" suggests the model's performance on this data is not only worse but also less stable and consistent.
* **Notable implications:** This pattern is characteristic of a model that can learn a specific pattern or distribution ("Match") but fails to generalize to a different, perhaps out-of-distribution or adversarial, set of data ("Mismatch"). The chart provides strong visual evidence for the model's specialization and its limitation in handling mismatched conditions. The initial drop for both suggests some universal early learning, but the long-term trends reveal the core disparity.