## Line Graph: Surprisal Trends Across Training Steps
### Overview
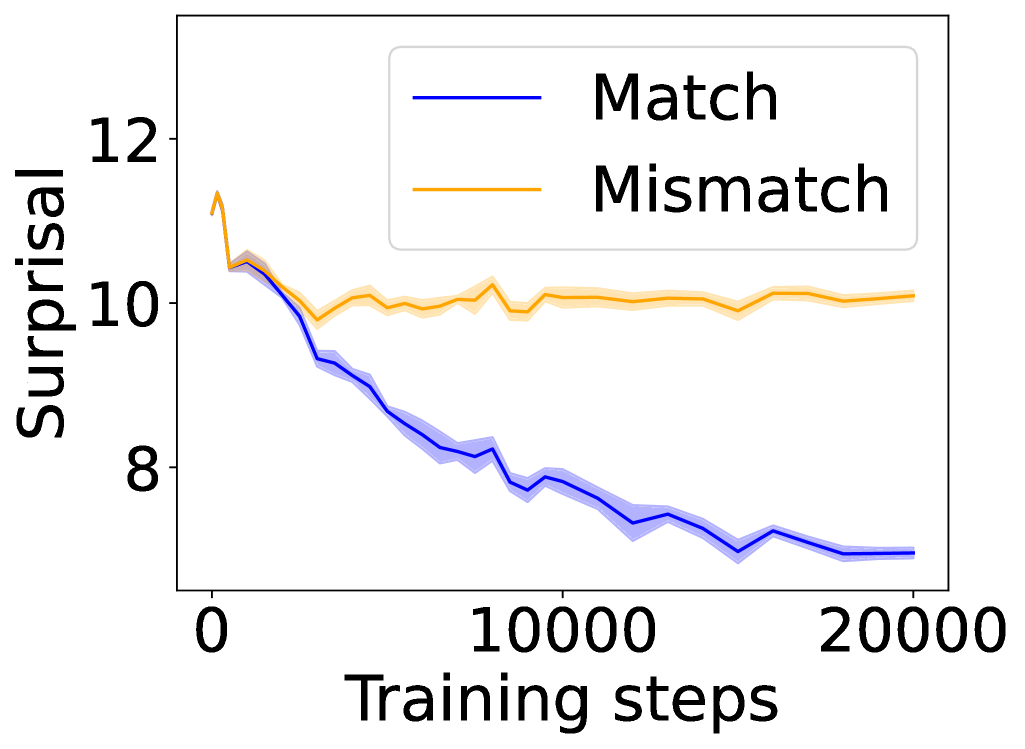
The image depicts a line graph comparing two data series labeled "Match" (blue) and "Mismatch" (orange) across 20,000 training steps. The y-axis measures "Surprisal" (a metric likely representing prediction uncertainty or error), while the x-axis tracks training progress. Both lines exhibit distinct trends, with the "Match" series declining sharply and the "Mismatch" series remaining relatively stable.
### Components/Axes
- **Y-axis (Surprisal)**: Labeled "Surprisal," scaled from 8 to 12 in increments of 1.
- **X-axis (Training steps)**: Labeled "Training steps," scaled from 0 to 20,000 in increments of 10,000.
- **Legend**: Positioned in the top-right corner, with:
- **Blue line**: "Match"
- **Orange line**: "Mismatch"
### Detailed Analysis
1. **Match (Blue Line)**:
- Starts at ~11.5 surprisal at 0 training steps.
- Declines steadily to ~7.0 surprisal by 20,000 steps.
- Exhibits minor fluctuations (e.g., slight dips at ~5,000 and ~15,000 steps).
- Shaded blue region (confidence interval?) narrows as training progresses.
2. **Mismatch (Orange Line)**:
- Begins at ~10.5 surprisal at 0 steps.
- Remains relatively flat (~10.0–11.0 surprisal) throughout training.
- Shows minor oscillations (e.g., peaks at ~3,000 and ~12,000 steps).
- Shaded orange region remains consistent in width.
### Key Observations
- The "Match" series demonstrates a **steady decline** in surprisal, suggesting improved performance or reduced uncertainty over training.
- The "Mismatch" series shows **no significant change**, implying stable performance or inherent difficulty in modeling mismatches.
- Both lines start with overlapping surprisal values (~10.5–11.5) but diverge sharply after ~5,000 steps.
### Interpretation
The data suggests that training effectively reduces surprisal for "Match" scenarios, likely due to the model learning patterns in these cases. In contrast, "Mismatch" surprisal remains high, indicating either:
1. **Inherent complexity** of mismatch patterns that the model cannot easily learn.
2. **Data imbalance**, where mismatch examples are underrepresented.
3. **Architectural limitations**, such as a model optimized for match prediction.
The divergence highlights a critical insight: training prioritizes match accuracy at the expense of mismatch performance, which may have implications for real-world applications requiring robust generalization. Further investigation into data distribution or model adjustments (e.g., balanced loss functions) could address this gap.