TECHNICAL ASSET FINGERPRINT
9e7705120c1a51877a74c768
Click to view fullscreen
Press ESC or click to close
FOUND IN PAPERS
EXPERT: healer-alpha-free VERSION 1
RUNTIME: free/openrouter/healer-alpha
INTEL_VERIFIED
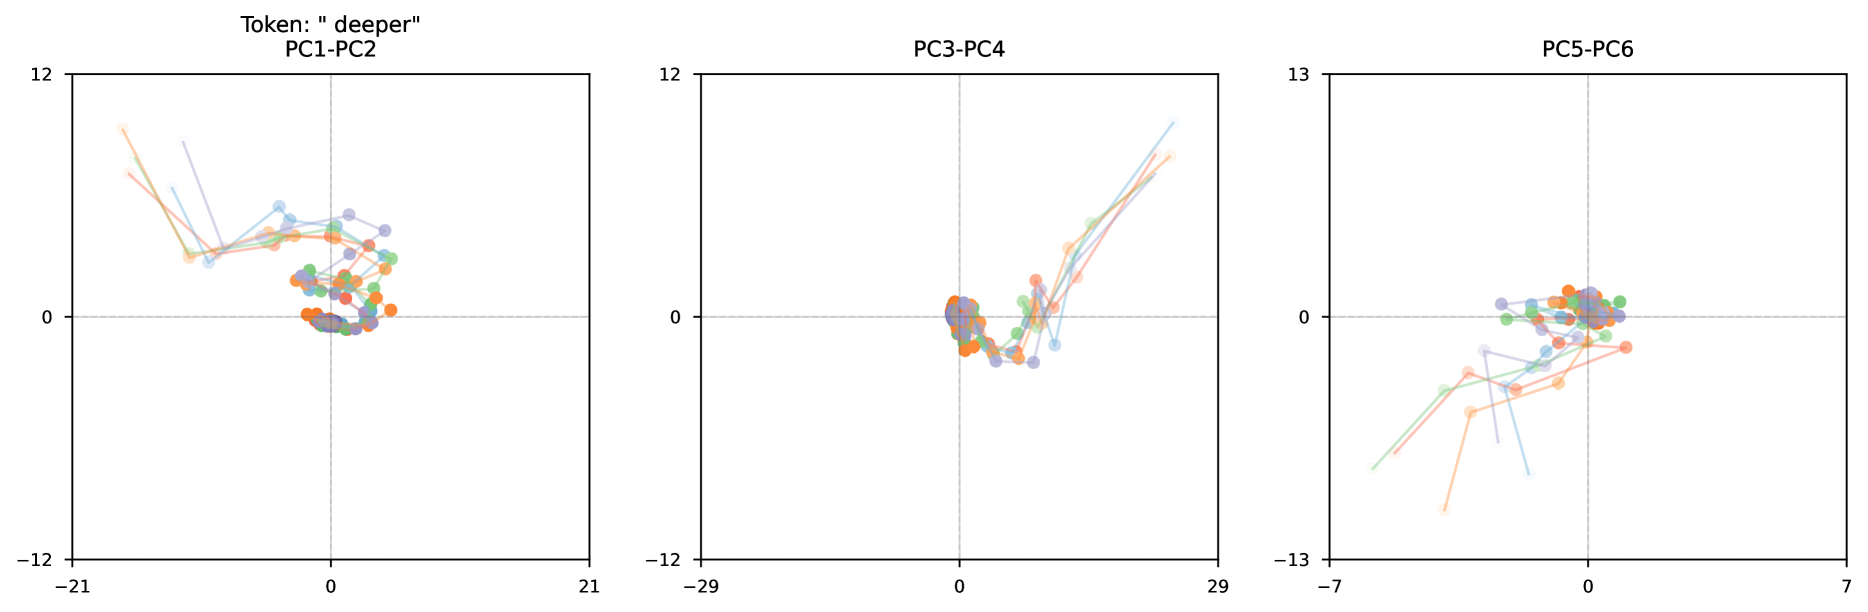
## PCA Scatter Plots: Token "deeper"
### Overview
The image displays three horizontally arranged scatter plots, each visualizing data points in a two-dimensional space defined by pairs of principal components (PCs). The overall title indicates the data pertains to the token "deeper". The plots show multiple colored data points connected by thin lines, suggesting trajectories or sequences across the principal component space. The data appears to be centered around the origin (0,0) in each plot, with varying degrees of spread and directional trends.
### Components/Axes
* **Main Title:** "Token: 'deeper'" (positioned above the leftmost plot).
* **Subplot Titles:**
* Left Plot: "PC1-PC2"
* Middle Plot: "PC3-PC4"
* Right Plot: "PC5-PC6"
* **Axes and Scales:**
* **PC1-PC2 Plot:**
* X-axis (PC1): Range approximately -21 to 21. Major tick marks at -21, 0, 21.
* Y-axis (PC2): Range approximately -12 to 12. Major tick marks at -12, 0, 12.
* **PC3-PC4 Plot:**
* X-axis (PC3): Range approximately -29 to 29. Major tick marks at -29, 0, 29.
* Y-axis (PC4): Range approximately -12 to 12. Major tick marks at -12, 0, 12.
* **PC5-PC6 Plot:**
* X-axis (PC5): Range approximately -7 to 7. Major tick marks at -7, 0, 7.
* Y-axis (PC6): Range approximately -13 to 13. Major tick marks at -13, 0, 13.
* **Data Series & Legend:** The plots contain data points in at least four distinct colors: orange, green, light blue, and purple. **No explicit legend is present in the image to define what these colors represent.** The points are connected by thin lines of matching or similar colors, forming small chains or trajectories.
* **Spatial Layout:** The three plots are aligned horizontally. Each plot is a square frame with a white background and black axes. Dashed grey lines mark the x=0 and y=0 axes within each plot.
### Detailed Analysis
**PC1-PC2 Plot (Left):**
* **Trend:** The data forms a loose cluster centered near the origin (0,0). Several trajectories extend from this central cluster towards the upper-left quadrant (negative PC1, positive PC2). One prominent orange trajectory starts near (-18, 10) and moves towards the center. A blue trajectory starts near (-15, 8) and moves inward.
* **Data Distribution:** The majority of points are concentrated within the range of PC1: -5 to 5 and PC2: -2 to 4. The spread is greater along the PC1 axis than the PC2 axis.
**PC3-PC4 Plot (Middle):**
* **Trend:** The data shows a very tight cluster at the origin, with a distinct set of trajectories extending into the upper-right quadrant (positive PC3, positive PC4). These extending lines are primarily light blue and orange.
* **Data Distribution:** The central cluster is dense within approximately PC3: -2 to 2 and PC4: -2 to 2. The extending trajectories reach out to approximately PC3=20, PC4=10. This plot has the widest x-axis range (-29 to 29).
**PC5-PC6 Plot (Right):**
* **Trend:** The data is again clustered near the origin, but with trajectories extending primarily into the lower-left quadrant (negative PC5, negative PC6). Green and orange lines are visible in this extending pattern.
* **Data Distribution:** The central cluster is located within roughly PC5: -1 to 1 and PC6: -1 to 1. The extending trajectories reach down to approximately PC5=-6, PC6=-10. This plot has the narrowest x-axis range (-7 to 7).
### Key Observations
1. **Central Tendency:** In all three PC spaces, the representation of the token "deeper" has a strong central tendency around the origin (0,0).
2. **Directional Spread:** The variance (spread) of the data is not isotropic. Each PC pair shows a dominant direction of spread:
* PC1-PC2: Spread towards the upper-left.
* PC3-PC4: Spread towards the upper-right.
* PC5-PC6: Spread towards the lower-left.
3. **Scale Discrepancy:** The scales of the principal components differ significantly. PC3 has the largest range (58 units), while PC5 has the smallest (14 units). This is typical for PCA, where components are ordered by explained variance.
4. **Trajectory Structure:** The data is not presented as isolated points but as connected sequences, implying an underlying process or ordering (e.g., layers in a neural network, steps in a process, or different contexts).
5. **Missing Legend:** The color coding of the points and lines is a critical piece of information that is not defined within the image. The colors likely represent different categories, layers, or conditions, but this cannot be determined from the visual data alone.
### Interpretation
This visualization likely comes from an analysis of neural network embeddings or activations for the specific token "deeper". Principal Component Analysis (PCA) has been applied to reduce the high-dimensional representation of this token across different contexts (e.g., different layers of a model, different sentences, or different attention heads) into 2D projections for visualization.
* **What the data suggests:** The token "deeper" has a core, stable representation (the central cluster) in the model's embedding space. However, its representation also varies systematically along specific directions captured by the principal components. The connected trajectories suggest that this variation is not random but follows a path, possibly corresponding to the token's changing role or meaning as information propagates through the network.
* **How elements relate:** The three plots show orthogonal (uncorrelated) views of the same high-dimensional variance. The dominant spread in different quadrants for each PC pair indicates that the primary axes of variation for this token are distinct and multi-directional. The color groups, if they represent, for example, different model layers, would show how the token's representation evolves along these axes.
* **Notable anomalies:** The most striking feature is the directional "comet-like" tails in each plot. These are not outliers in a traditional sense but rather evidence of structured, low-dimensional variation within the token's representation. The absence of a legend is a significant limitation for full interpretation, as the meaning of the color groups is essential to understand the source of the variance (e.g., is the spread due to layer depth, syntactic context, or semantic role?).
**Language Note:** All text in the image is in English.
DECODING INTELLIGENCE...