## Line Chart: Lichess Puzzle Accuracy vs. Training Step for Two Models
### Overview
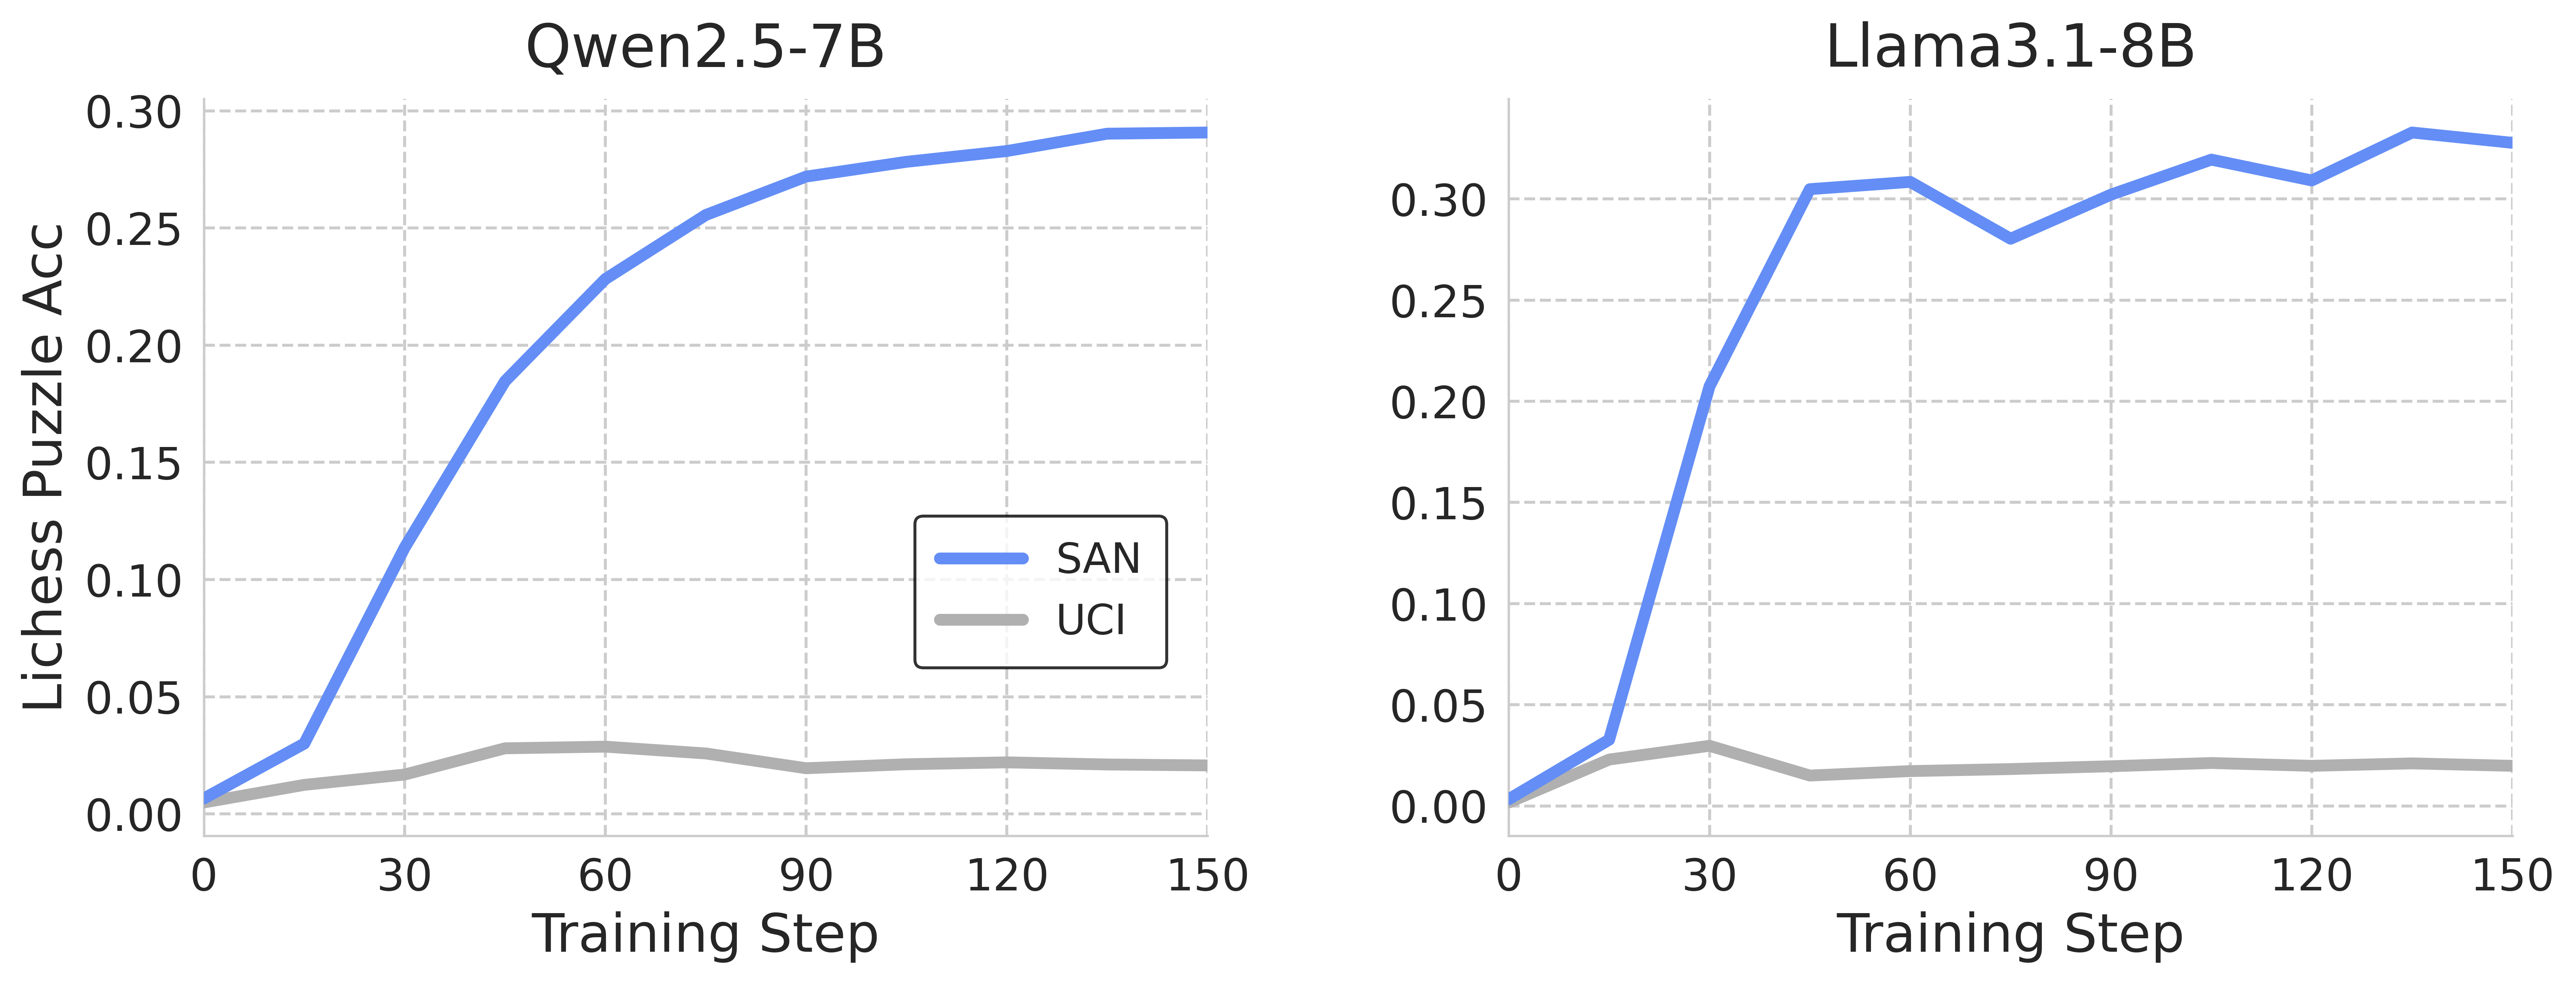
The image presents two line charts side-by-side, comparing the performance of two language models – Qwen2.5-7B and Llama3.1-8B – on Lichess puzzles during training. The y-axis represents the puzzle accuracy (Lichess Puzzle Acc), and the x-axis represents the training step. Each chart displays two lines representing different evaluation methods: SAN and UCI.
### Components/Axes
* **X-axis:** Training Step (ranging from 0 to 150, with markers at 0, 30, 60, 90, 120, and 150).
* **Y-axis:** Lichess Puzzle Acc (ranging from 0.00 to 0.30, with markers at 0.05 intervals).
* **Left Chart Title:** Qwen2.5-7B
* **Right Chart Title:** Llama3.1-8B
* **Legend (Left Chart):**
* SAN (Blue Line)
* UCI (Gray Line)
* **Legend (Right Chart):**
* SAN (Blue Line)
* UCI (Gray Line)
### Detailed Analysis or Content Details
**Qwen2.5-7B Chart:**
* **SAN Line (Blue):** The SAN line starts at approximately 0.02 at Training Step 0. It exhibits a steep upward trend until around Training Step 60, reaching approximately 0.26. It plateaus between Training Steps 60 and 120, hovering around 0.28. Finally, it slightly decreases to approximately 0.27 at Training Step 150.
* **UCI Line (Gray):** The UCI line starts at approximately 0.01 at Training Step 0. It shows a slow, gradual increase throughout the entire training process. At Training Step 150, it reaches approximately 0.04.
**Llama3.1-8B Chart:**
* **SAN Line (Blue):** The SAN line begins at approximately 0.03 at Training Step 0. It rapidly increases to approximately 0.28 by Training Step 30. It then fluctuates between approximately 0.28 and 0.31, peaking at around 0.31 at Training Step 90. It decreases slightly to approximately 0.30 at Training Step 150.
* **UCI Line (Gray):** The UCI line starts at approximately 0.01 at Training Step 0. It shows a slow, gradual increase throughout the training process, similar to the Qwen2.5-7B model. At Training Step 150, it reaches approximately 0.04.
### Key Observations
* Both models show significantly higher accuracy when evaluated using the SAN method compared to the UCI method.
* Qwen2.5-7B reaches a plateau in SAN accuracy relatively early in training (around step 60), while Llama3.1-8B continues to fluctuate and maintain a higher accuracy for a longer period.
* The UCI accuracy for both models remains consistently low throughout the training process.
* Llama3.1-8B demonstrates a faster initial learning rate (SAN line) compared to Qwen2.5-7B.
### Interpretation
The data suggests that both Qwen2.5-7B and Llama3.1-8B models improve their ability to solve Lichess puzzles as they are trained. The substantial difference in accuracy between the SAN and UCI evaluation methods indicates that the UCI method may be less sensitive to the models' performance or may be evaluating different aspects of the problem-solving process.
The plateau observed in Qwen2.5-7B's SAN accuracy could indicate that the model has reached its maximum performance level with the given training data and parameters. The continued fluctuation in Llama3.1-8B's SAN accuracy suggests that it may still be learning and adapting, potentially benefiting from further training.
The consistently low UCI accuracy for both models raises questions about the effectiveness of the UCI method for evaluating these models on Lichess puzzles. It's possible that the UCI method is more susceptible to noise or that it requires a different training approach to yield meaningful results. The faster initial learning rate of Llama3.1-8B suggests it may be more efficient at learning the underlying patterns in the Lichess puzzle data.