## Line Graph: Model Performance Comparison Across Recurrent Steps
### Overview
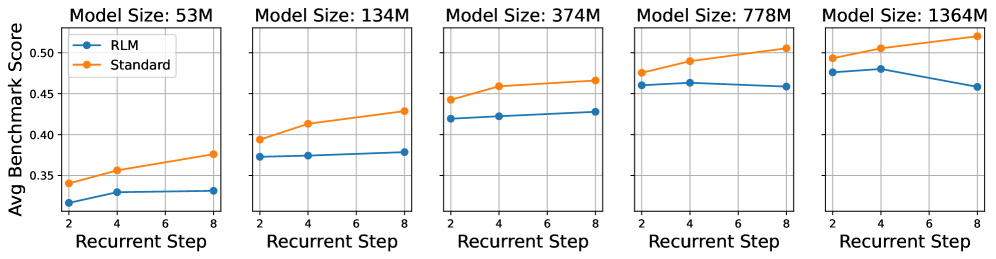
The image contains five side-by-side line graphs comparing the performance of two models ("RLM" and "Standard") across different model sizes (53M, 134M, 374M, 778M, 1364M). Each graph plots "Avg Benchmark Score" against "Recurrent Step" (2–8). The graphs show distinct trends between the two models, with "Standard" generally outperforming "RLM" as recurrent steps increase.
---
### Components/Axes
- **X-axis**: "Recurrent Step" (values: 2, 4, 6, 8)
- **Y-axis**: "Avg Benchmark Score" (range: 0.3–0.55, increments of 0.05)
- **Legends**:
- Blue circles: "RLM"
- Orange circles: "Standard"
- **Subplot Titles**: Model sizes (e.g., "Model Size: 53M", "Model Size: 1364M")
- **Gridlines**: Light gray horizontal and vertical lines for reference.
---
### Detailed Analysis
#### Model Size: 53M
- **RLM**: Starts at ~0.32 (step 2), remains flat (~0.33–0.34) through step 8.
- **Standard**: Increases steadily from ~0.34 (step 2) to ~0.38 (step 8).
#### Model Size: 134M
- **RLM**: Flat (~0.36–0.37) across all steps.
- **Standard**: Rises from ~0.39 (step 2) to ~0.43 (step 8).
#### Model Size: 374M
- **RLM**: Slight increase from ~0.42 (step 2) to ~0.43 (step 8).
- **Standard**: Steeper rise from ~0.45 (step 2) to ~0.47 (step 8).
#### Model Size: 778M
- **RLM**: Peaks at ~0.46 (step 4), then declines to ~0.45 (step 8).
- **Standard**: Consistent upward trend from ~0.48 (step 2) to ~0.51 (step 8).
#### Model Size: 1364M
- **RLM**: Starts high (~0.47) at step 2, drops to ~0.46 (step 8).
- **Standard**: Sharp increase from ~0.49 (step 2) to ~0.53 (step 8).
---
### Key Observations
1. **Performance Gap**: "Standard" consistently outperforms "RLM" across all model sizes, with the gap widening as model size increases.
2. **Recurrent Step Impact**:
- "Standard" shows clear improvement with more recurrent steps (e.g., +0.15 in 1364M).
- "RLM" remains stable or declines slightly in larger models (e.g., -0.01 in 1364M).
3. **Model Size Correlation**: Larger models (e.g., 1364M) achieve higher absolute scores but exhibit more pronounced divergence between the two architectures.
---
### Interpretation
The data suggests that the "Standard" model scales more effectively with increased recurrent steps, particularly in larger architectures. This could indicate better handling of long-term dependencies or optimization for sequential tasks. In contrast, "RLM" demonstrates stability but limited improvement, potentially prioritizing robustness over adaptability. The widening performance gap in larger models (e.g., 1364M) implies that model size amplifies architectural differences, favoring "Standard" for complex, step-dependent tasks. No outliers or anomalies are observed; trends align consistently across subplots.