## Line Chart: Advantage σ vs. Global Step
### Overview
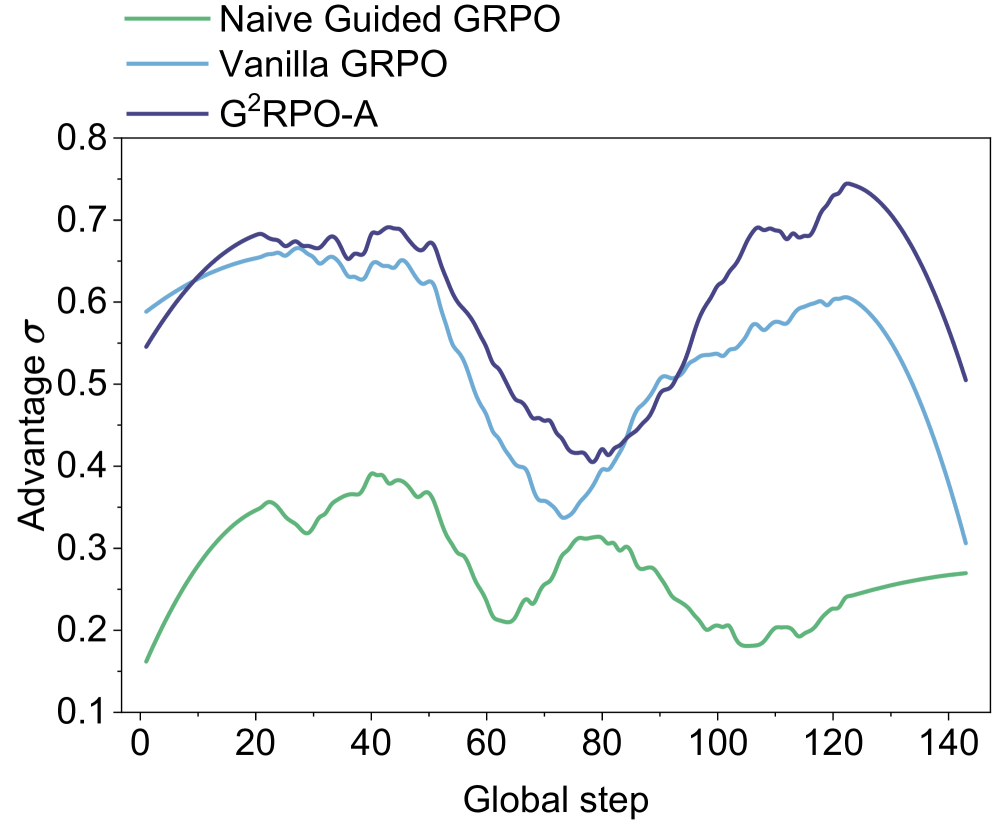
This image presents a line chart comparing the "Advantage σ" metric across three different algorithms – Naive Guided GRPO, Vanilla GRPO, and G²RPO-A – as a function of the "Global step". The chart visualizes the performance of each algorithm over 140 global steps. A shaded region around each line indicates some measure of variance or confidence interval.
### Components/Axes
* **X-axis:** "Global step", ranging from 0 to 140.
* **Y-axis:** "Advantage σ", ranging from 0.1 to 0.8.
* **Legend:** Located in the top-left corner, identifying the three data series:
* Naive Guided GRPO (Green line)
* Vanilla GRPO (Blue line)
* G²RPO-A (Dark Blue line)
* **Shaded Regions:** Light blue shaded areas around each line, representing a confidence interval or standard deviation.
### Detailed Analysis
Let's analyze each line individually, noting trends and approximate data points.
* **Naive Guided GRPO (Green):** This line starts at approximately 0.15 at Global step 0, increases to a peak of around 0.35 at Global step 20, then gradually declines to approximately 0.25 at Global step 140. The line exhibits significant fluctuations throughout the entire range.
* **Vanilla GRPO (Blue):** This line begins at approximately 0.55 at Global step 0, increases to a peak of around 0.65 at Global step 10, then decreases to a low of approximately 0.4 at Global step 80. It then recovers to around 0.62 at Global step 140. This line also shows fluctuations, but generally remains higher than the Naive Guided GRPO line.
* **G²RPO-A (Dark Blue):** This line starts at approximately 0.58 at Global step 0, increases to a peak of around 0.73 at Global step 60, then decreases to approximately 0.68 at Global step 140. The shaded region around this line is relatively narrow, suggesting lower variance compared to the other two algorithms.
Here's a more detailed breakdown of approximate values at specific Global steps:
| Global Step | Naive Guided GRPO (σ) | Vanilla GRPO (σ) | G²RPO-A (σ) |
|-------------|------------------------|-------------------|-------------|
| 0 | 0.15 | 0.55 | 0.58 |
| 20 | 0.35 | 0.63 | 0.68 |
| 40 | 0.32 | 0.60 | 0.70 |
| 60 | 0.28 | 0.45 | 0.73 |
| 80 | 0.25 | 0.40 | 0.65 |
| 100 | 0.24 | 0.50 | 0.66 |
| 120 | 0.24 | 0.60 | 0.68 |
| 140 | 0.25 | 0.62 | 0.68 |
### Key Observations
* G²RPO-A consistently demonstrates the highest "Advantage σ" throughout the observed global steps, indicating superior performance compared to the other two algorithms.
* Vanilla GRPO initially performs well but experiences a significant drop in "Advantage σ" around Global step 60-80 before recovering.
* Naive Guided GRPO consistently exhibits the lowest "Advantage σ" and the most significant fluctuations, suggesting it is the least stable and effective algorithm.
* The shaded regions indicate that G²RPO-A has the lowest variance in its performance, while Naive Guided GRPO has the highest.
### Interpretation
The chart suggests that G²RPO-A is the most robust and effective algorithm for maximizing "Advantage σ" over the observed global steps. The consistent high performance and low variance of G²RPO-A indicate its reliability and stability. Vanilla GRPO shows promise but is susceptible to performance dips, while Naive Guided GRPO consistently underperforms and exhibits high instability.
The "Advantage σ" metric likely represents a measure of the algorithm's success in achieving a desired outcome or solving a specific problem. The "Global step" likely refers to the iteration or time step in the algorithm's execution. The shaded regions around the lines suggest that the reported "Advantage σ" values are not deterministic and may vary due to factors such as randomness or data variations.
The initial increase in "Advantage σ" for all algorithms likely represents a period of rapid learning or improvement. The subsequent fluctuations and declines may indicate convergence towards a local optimum or the influence of challenging data points. The recovery of Vanilla GRPO after Global step 80 suggests its ability to adapt and overcome obstacles.