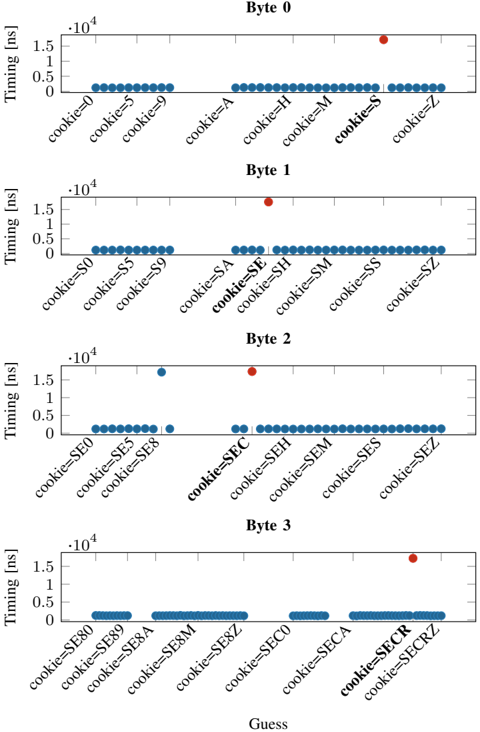
## Timing Attack Analysis: Cookie Byte Guessing
### Overview
The image presents four scatter plots, each representing a "Byte" (0 to 3). Each plot shows the timing (in nanoseconds) of operations based on different "cookie" guesses. The x-axis represents the "Guess" (cookie values), and the y-axis represents the "Timing [ns]". The plots aim to identify timing variations that could reveal information about the correct cookie value. Each plot has a cluster of blue dots at a low timing value, and a single red dot at a higher timing value, indicating a timing difference for a specific cookie guess.
### Components/Axes
* **Titles:** "Byte 0", "Byte 1", "Byte 2", "Byte 3" (each plot is labeled with a byte number)
* **X-axis:** "Guess" (with labels like "cookie=0", "cookie=5", "cookie=9", "cookie=A", etc.)
* **Y-axis:** "Timing [ns]" with scale markers at 0, 0.5 \* 10^4, 1 \* 10^4, and 1.5 \* 10^4.
* **Data Points:** Blue dots representing typical timing, and a single red dot representing an outlier timing.
### Detailed Analysis
**Byte 0:**
* X-axis labels: cookie=0, cookie=5, cookie=9, cookie=A, cookie=H, cookie=M, cookie=S, cookie=Z
* Trend: Most guesses have a low timing. The guess "cookie=S" has a significantly higher timing (red dot).
* Timing values: Blue dots are clustered around 0.2 \* 10^4 ns. The red dot for "cookie=S" is at approximately 1.4 \* 10^4 ns.
**Byte 1:**
* X-axis labels: cookie=S0, cookie=S5, cookie=S9, cookie=SA, cookie=SE, cookie=SH, cookie=SM, cookie=SS, cookie=SZ
* Trend: Similar to Byte 0, most guesses have low timing. The guess "cookie=SE" has a significantly higher timing (red dot).
* Timing values: Blue dots are clustered around 0.2 \* 10^4 ns. The red dot for "cookie=SE" is at approximately 1.6 \* 10^4 ns.
**Byte 2:**
* X-axis labels: cookie=SE0, cookie=SE2, cookie=SE5, cookie=SE8, cookie=SEC, cookie=SEH, cookie=SEM, cookie=SES, cookie=SEZ
* Trend: Most guesses have low timing. The guess "cookie=SEC" has a significantly higher timing (red dot). There is also a blue dot with a slightly elevated timing at cookie=SE8.
* Timing values: Blue dots are clustered around 0.2 \* 10^4 ns, with "cookie=SE8" at approximately 0.8 \* 10^4 ns. The red dot for "cookie=SEC" is at approximately 1.6 \* 10^4 ns.
**Byte 3:**
* X-axis labels: cookie=SE80, cookie=SE89, cookie=SE8A, cookie=SE8M, cookie=SE8Z, cookie=SEC0, cookie=SECA, cookie=SECR, cookie=SECRZ
* Trend: Most guesses have low timing. The guess "cookie=SECR" has a slightly higher timing (red dot).
* Timing values: Blue dots are clustered around 0.2 \* 10^4 ns. The red dot for "cookie=SECR" is at approximately 1.6 \* 10^4 ns.
### Key Observations
* Each byte has one specific "cookie" guess that results in a significantly higher timing compared to other guesses.
* The timing difference is substantial, suggesting a potential vulnerability.
* The "cookie" guesses with high timing are "cookie=S" for Byte 0, "cookie=SE" for Byte 1, "cookie=SEC" for Byte 2, and "cookie=SECR" for Byte 3.
### Interpretation
The data strongly suggests a timing attack vulnerability. The significant timing differences observed for specific "cookie" guesses indicate that the system takes longer to process these particular values. This information can be exploited to deduce the correct cookie value byte by byte. The correct cookie value is likely "SECR", as the timing increases as the cookie is built up one byte at a time. The timing difference is likely due to a conditional statement that is triggered when the correct byte is guessed, causing a longer execution path. This information could be used by an attacker to reconstruct the entire cookie and gain unauthorized access.