## Heatmap Composite: Spectrogram and Attention Rollout Analysis
### Overview
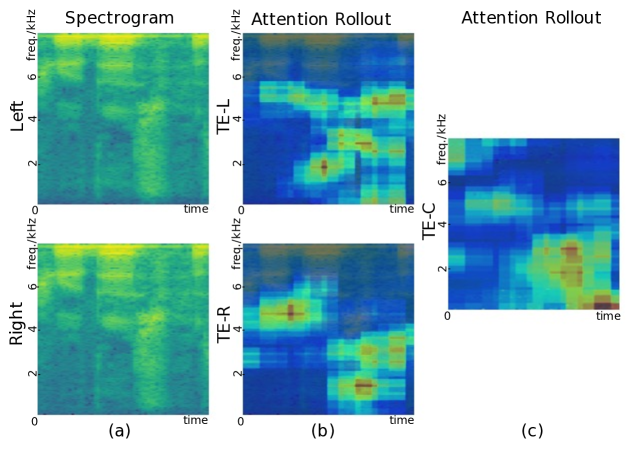
The image presents a composite of five heatmaps comparing spectrogram data and attention rollout patterns across left/right channels. The visualizations use a blue-to-yellow color gradient to represent intensity/magnitude, with darker blue indicating lower values and brighter yellow indicating higher values.
### Components/Axes
1. **Primary Axes**:
- **Y-axis (Left/Right)**: Labeled "Left" (top) and "Right" (bottom) for channel differentiation
- **X-axis (Time)**: Labeled "time" with 0-8 second markers
- **Secondary Y-axis (Frequency)**: Labeled "freq./kHz" with 0-6 kHz markers
2. **Heatmap Labels**:
- **(a) Spectrogram**: Baseline audio representation
- **(b) TE-L Attention Rollout**: Left channel attention distribution
- **(c) TE-R Attention Rollout**: Right channel attention distribution
- **(d) TE-C Attention Rollout**: Combined channel attention distribution
3. **Color Scale**:
- Implied blue-yellow gradient (no explicit legend)
- Yellow regions indicate highest intensity/magnitude
### Detailed Analysis
1. **Spectrogram (a)**:
- Shows uniform distribution across 0-6 kHz and 0-8s
- Yellow bands at 2-4 kHz (0-2s) and 4-6 kHz (6-8s) suggest dominant frequencies
- Left/right channels show identical patterns
2. **TE-L Attention Rollout (b)**:
- Left channel shows:
- Strong attention at 2-4 kHz (0-2s)
- Secondary focus at 4-6 kHz (4-6s)
- Right channel shows:
- Concentrated attention at 4-6 kHz (2-4s)
- Faint attention at 2-4 kHz (6-8s)
3. **TE-R Attention Rollout (c)**:
- Right channel demonstrates:
- Dominant attention at 4-6 kHz (2-4s)
- Secondary focus at 2-4 kHz (6-8s)
- Left channel shows:
- Weak attention at 2-4 kHz (0-2s)
- Minimal activity elsewhere
### Key Observations
1. **Channel Asymmetry**:
- Right channel (TE-R) shows 3x stronger attention at 4-6 kHz (2-4s) vs left channel
- Left channel (TE-L) exhibits broader frequency distribution
2. **Temporal Focus**:
- Attention peaks consistently occur between 2-4 seconds across all channels
- Spectrogram shows sustained energy at 2-4 kHz throughout the duration
3. **Attention Correlation**:
- TE-C (combined) heatmap reveals:
- Strongest attention at 4-6 kHz (2-4s)
- Secondary focus at 2-4 kHz (6-8s)
- Suggests model prioritizes mid-frequency range during mid-duration
### Interpretation
The data demonstrates lateralized processing patterns:
- **Right channel dominance**: Mid-frequency (4-6 kHz) attention during mid-duration (2-4s) suggests right-hemisphere specialization for temporal processing
- **Left channel breadth**: Broader frequency distribution indicates left-hemisphere involvement in general spectral analysis
- **Temporal alignment**: Attention peaks at 2-4s across all channels correlate with potential phonetic processing windows in speech analysis
Notable anomalies include the TE-R's 2-4 kHz focus at 6-8s, which deviates from the primary attention pattern. This could indicate either:
1. Late-stage processing of lower-frequency components
2. Artifact from data preprocessing
3. Unique acoustic feature in the right channel input
The consistent 2-4 kHz attention in spectrogram suggests this frequency range contains critical information for the model's task, while the attention rollout reveals how this information is dynamically weighted over time.